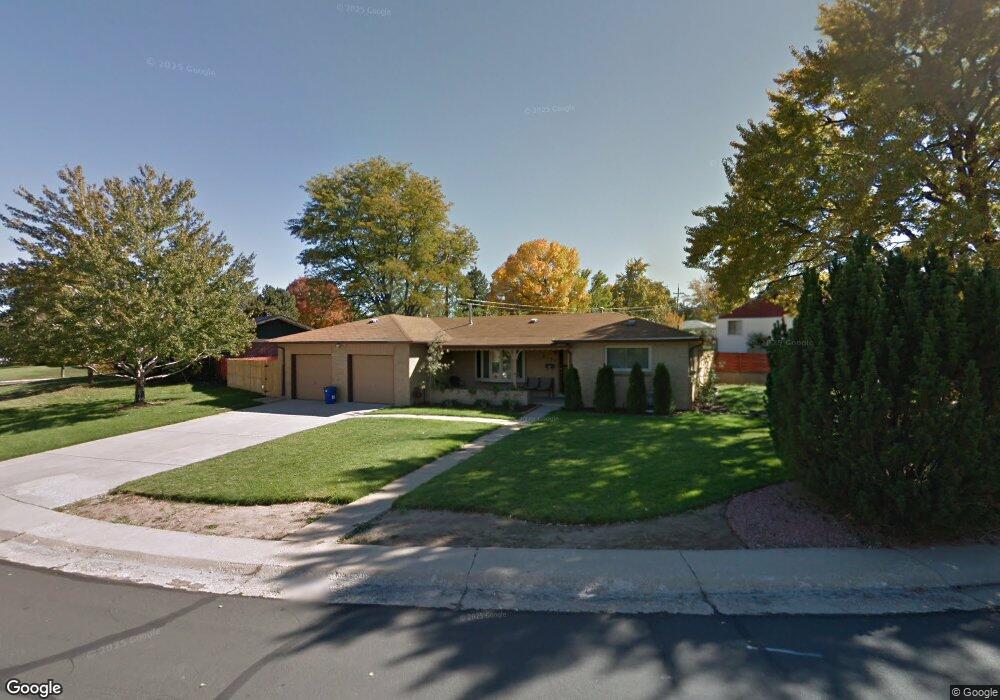
6190 W 42nd Ave Wheat Ridge, CO 80033
Barths NeighborhoodEstimated Value: $593,540 - $684,000
3
Beds
2
Baths
1,430
Sq Ft
$451/Sq Ft
Est. Value
About This Home
This home is located at 6190 W 42nd Ave, Wheat Ridge, CO 80033 and is currently estimated at $644,635, approximately $450 per square foot. 6190 W 42nd Ave is a home located in Jefferson County with nearby schools including Stevens Elementary School, Everitt Middle School, and Wheat Ridge High School.
Ownership History
Date
Name
Owned For
Owner Type
Purchase Details
Closed on
Jun 22, 2012
Sold by
Kelly Daniel S
Bought by
Beasley Banks K
Current Estimated Value
Home Financials for this Owner
Home Financials are based on the most recent Mortgage that was taken out on this home.
Original Mortgage
$216,113
Outstanding Balance
$149,211
Interest Rate
3.75%
Mortgage Type
FHA
Estimated Equity
$495,424
Purchase Details
Closed on
May 15, 2006
Sold by
Ortega Deborah L and Rincon Jose G
Bought by
Kelly Daniel S
Home Financials for this Owner
Home Financials are based on the most recent Mortgage that was taken out on this home.
Original Mortgage
$195,200
Interest Rate
6.37%
Mortgage Type
Fannie Mae Freddie Mac
Purchase Details
Closed on
Nov 15, 2002
Sold by
Regester Edna Viola
Bought by
Ortega Deborah L and Rincon Jose G
Home Financials for this Owner
Home Financials are based on the most recent Mortgage that was taken out on this home.
Original Mortgage
$219,554
Interest Rate
6.13%
Mortgage Type
FHA
Create a Home Valuation Report for This Property
The Home Valuation Report is an in-depth analysis detailing your home's value as well as a comparison with similar homes in the area
Home Values in the Area
Average Home Value in this Area
Purchase History
| Date | Buyer | Sale Price | Title Company |
|---|---|---|---|
| Beasley Banks K | $220,101 | Land Title Guarantee Company | |
| Kelly Daniel S | $244,000 | Empire Title & Escrow | |
| Ortega Deborah L | $223,000 | -- |
Source: Public Records
Mortgage History
| Date | Status | Borrower | Loan Amount |
|---|---|---|---|
| Open | Beasley Banks K | $216,113 | |
| Previous Owner | Kelly Daniel S | $195,200 | |
| Previous Owner | Ortega Deborah L | $219,554 |
Source: Public Records
Tax History Compared to Growth
Tax History
| Year | Tax Paid | Tax Assessment Tax Assessment Total Assessment is a certain percentage of the fair market value that is determined by local assessors to be the total taxable value of land and additions on the property. | Land | Improvement |
|---|---|---|---|---|
| 2024 | $3,202 | $36,618 | $16,440 | $20,178 |
| 2023 | $3,202 | $36,618 | $16,440 | $20,178 |
| 2022 | $2,682 | $30,120 | $16,564 | $13,556 |
| 2021 | $2,719 | $30,988 | $17,041 | $13,947 |
| 2020 | $2,458 | $28,157 | $15,617 | $12,540 |
| 2019 | $2,425 | $28,157 | $15,617 | $12,540 |
| 2018 | $2,208 | $24,775 | $9,598 | $15,177 |
| 2017 | $1,994 | $24,775 | $9,598 | $15,177 |
| 2016 | $1,736 | $20,186 | $6,280 | $13,906 |
| 2015 | $1,504 | $20,186 | $6,280 | $13,906 |
| 2014 | $1,504 | $16,405 | $5,731 | $10,674 |
Source: Public Records
Map
Nearby Homes
- 4365 Kendall St
- 4295 Harlan St
- 6005 W 39th Ave Unit 6005
- 5926 W 41st Ave Unit 10
- 4045 Fenton Ct
- 4015 Fenton Ct
- 6145 W 38th Ave
- 6455 W 38th Ave
- 4125 Pierce St
- 4144 Depew St
- 3830 Otis St Unit 1-4
- 4095 Quay St
- 3820 Pierce St
- 3830 Pierce St
- 5904 W 37th Place
- 5667 W 38th Ave
- 6735 W 37th Place
- 7010 W 44th Ave
- 4320 Benton St
- 5630 W 38th Ave Unit B