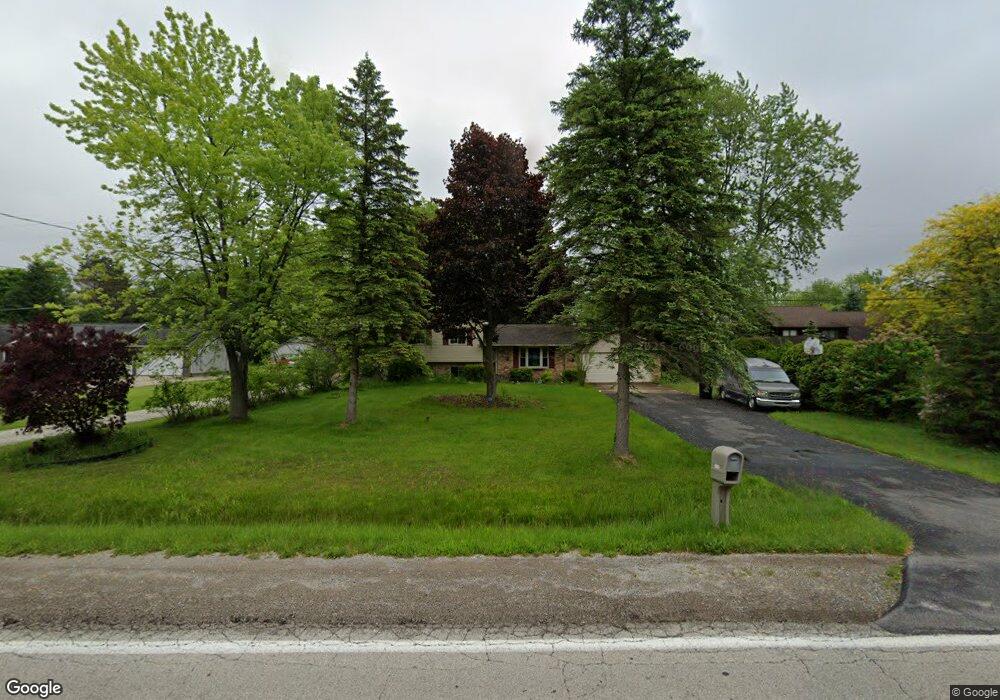
6196 Johnson Rd Flushing, MI 48433
Estimated Value: $210,000 - $236,000
Studio
1
Bath
1,520
Sq Ft
$146/Sq Ft
Est. Value
About This Home
This home is located at 6196 Johnson Rd, Flushing, MI 48433 and is currently estimated at $221,632, approximately $145 per square foot. 6196 Johnson Rd is a home located in Genesee County with nearby schools including Elms Elementary School, Flushing Middle School, and Flushing High School.
Ownership History
Date
Name
Owned For
Owner Type
Purchase Details
Closed on
Sep 18, 2020
Sold by
Kotarak Celia Irene and Dolores Diane Shaft Trust
Bought by
Rodiadek Leann and Davies Jeffrey
Current Estimated Value
Home Financials for this Owner
Home Financials are based on the most recent Mortgage that was taken out on this home.
Original Mortgage
$137,750
Outstanding Balance
$122,244
Interest Rate
2.9%
Mortgage Type
New Conventional
Estimated Equity
$99,388
Purchase Details
Closed on
Jan 16, 2007
Sold by
Fannie Mae
Bought by
Brandon Dorothy J and Brandon Scott
Purchase Details
Closed on
Jun 26, 2006
Sold by
Flagstar Bank Fsb
Bought by
Federal National Mortgage Association
Purchase Details
Closed on
Apr 5, 2006
Sold by
Faber Kenneth and Wilber Lori
Bought by
Flagstar Bank Fsb
Purchase Details
Closed on
Oct 5, 2001
Sold by
Faber Kenneth J and Faber Brenda R
Bought by
Faber Kenneth and Wilber Lori
Create a Home Valuation Report for This Property
The Home Valuation Report is an in-depth analysis detailing your home's value as well as a comparison with similar homes in the area
Home Values in the Area
Average Home Value in this Area
Purchase History
| Date | Buyer | Sale Price | Title Company |
|---|---|---|---|
| Rodiadek Leann | $145,000 | Cislo Ttl Co Ins & Escrow Sv | |
| Brandon Dorothy J | $125,000 | Guaranty Title Company | |
| Federal National Mortgage Association | -- | None Available | |
| Flagstar Bank Fsb | $132,871 | None Available | |
| Faber Kenneth | $123,750 | Guaranty Title Company |
Source: Public Records
Mortgage History
| Date | Status | Borrower | Loan Amount |
|---|---|---|---|
| Open | Rodiadek Leann | $137,750 |
Source: Public Records
Tax History
| Year | Tax Paid | Tax Assessment Tax Assessment Total Assessment is a certain percentage of the fair market value that is determined by local assessors to be the total taxable value of land and additions on the property. | Land | Improvement |
|---|---|---|---|---|
| 2025 | $2,339 | $100,500 | $0 | $0 |
| 2024 | $1,238 | $97,400 | $0 | $0 |
| 2023 | $1,368 | $90,200 | $0 | $0 |
| 2022 | $2,101 | $79,500 | $0 | $0 |
| 2021 | $2,059 | $74,800 | $0 | $0 |
| 2020 | $1,295 | $70,700 | $0 | $0 |
| 2019 | $1,290 | $64,300 | $0 | $0 |
| 2018 | $2,195 | $57,400 | $0 | $0 |
| 2017 | $962 | $57,400 | $0 | $0 |
| 2016 | $1,912 | $55,200 | $0 | $0 |
| 2015 | $1,620 | $54,400 | $0 | $0 |
| 2014 | $947 | $51,800 | $0 | $0 |
| 2012 | -- | $50,100 | $50,100 | $0 |
Source: Public Records
Map
Nearby Homes
- 5465 Johnson Rd
- 7067 W Stanley Rd
- 9031 N Island Dr Unit 29
- 6355 N Mckinley Rd
- 8454 Wesley Dr
- 8520 Apple Blossom Ln
- 0 N Island Dr Unit 20230029447
- 621 Ashwood Dr
- 7181 W Mount Morris Rd
- 9207 N Island Ct Unit 12
- 515 Chestnut St
- 1216 Pleasantview Dr
- 0 Double Tree Estates
- 507 Dale St
- 433 Crestview St
- Vacant Land Rd
- Vacant Land Rd
- Vacant Land Rd
- 1449 Coutant St
- 7267 109th St
- 6182 Johnson Rd
- 6156 Johnson Rd
- 6207 Johnson Rd
- 6195 Johnson Rd
- 6179 Johnson Rd
- 6202 Johnson Rd
- 6169 Johnson Rd
- 6223 Johnson Rd
- 6140 Johnson Rd
- 6237 Johnson Rd
- 6256 Johnson Rd
- 6159 Johnson Rd
- 6226 Johnson Rd
- 6168 Johnson Rd
- 6130 Johnson Rd
- 6149 Johnson Rd
- 6249 Johnson Rd
- 6139 Johnson Rd
- 6120 Johnson Rd
- 6268 Johnson Rd
Your Personal Tour Guide
Ask me questions while you tour the home.