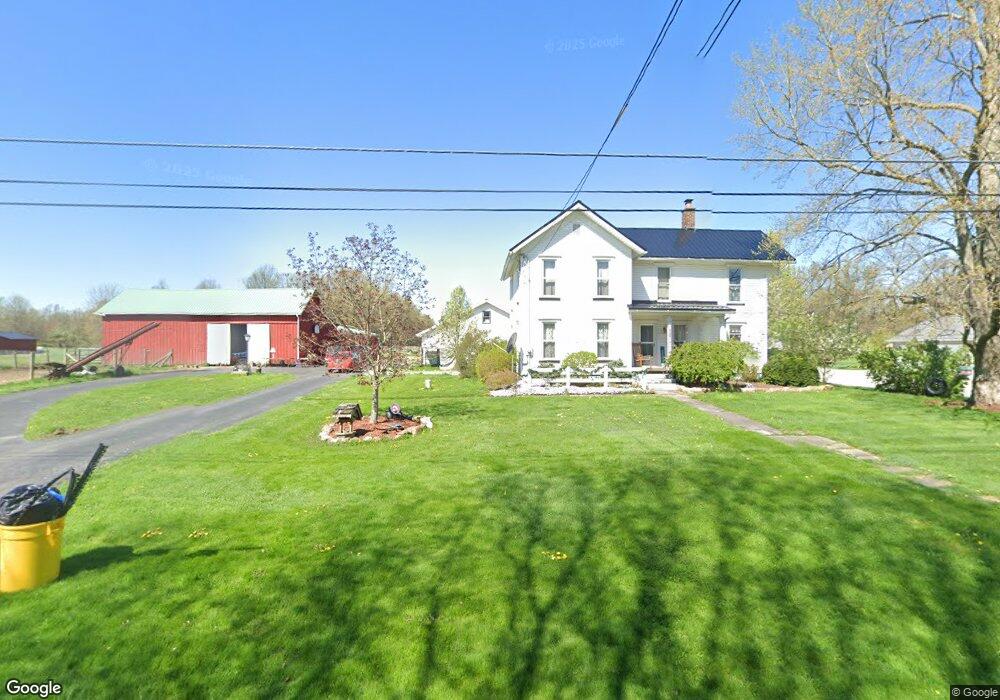
6199 Thompson Clark Rd Bristolville, OH 44402
Estimated Value: $287,000 - $366,000
4
Beds
2
Baths
1,768
Sq Ft
$188/Sq Ft
Est. Value
About This Home
This home is located at 6199 Thompson Clark Rd, Bristolville, OH 44402 and is currently estimated at $333,231, approximately $188 per square foot. 6199 Thompson Clark Rd is a home located in Trumbull County with nearby schools including Bristol Elementary School and Bristol High School.
Ownership History
Date
Name
Owned For
Owner Type
Purchase Details
Closed on
Jul 23, 2019
Sold by
Agler Edgar A and Agler Nancy L
Bought by
Mckinley Alison K
Current Estimated Value
Home Financials for this Owner
Home Financials are based on the most recent Mortgage that was taken out on this home.
Original Mortgage
$195,500
Outstanding Balance
$171,205
Interest Rate
3.8%
Mortgage Type
Unknown
Estimated Equity
$162,026
Purchase Details
Closed on
Jul 28, 1995
Sold by
Mason Arlan R
Bought by
Agler Edgar A and Agler Nancy Agler
Home Financials for this Owner
Home Financials are based on the most recent Mortgage that was taken out on this home.
Original Mortgage
$70,000
Interest Rate
7.59%
Mortgage Type
New Conventional
Purchase Details
Closed on
Jan 1, 1990
Bought by
Arlan Arlan R and Arlan Arlene W
Create a Home Valuation Report for This Property
The Home Valuation Report is an in-depth analysis detailing your home's value as well as a comparison with similar homes in the area
Home Values in the Area
Average Home Value in this Area
Purchase History
| Date | Buyer | Sale Price | Title Company |
|---|---|---|---|
| Mckinley Alison K | $230,000 | None Available | |
| Agler Edgar A | $125,000 | -- | |
| Arlan Arlan R | -- | -- |
Source: Public Records
Mortgage History
| Date | Status | Borrower | Loan Amount |
|---|---|---|---|
| Open | Mckinley Alison K | $195,500 | |
| Previous Owner | Agler Edgar A | $70,000 |
Source: Public Records
Tax History Compared to Growth
Tax History
| Year | Tax Paid | Tax Assessment Tax Assessment Total Assessment is a certain percentage of the fair market value that is determined by local assessors to be the total taxable value of land and additions on the property. | Land | Improvement |
|---|---|---|---|---|
| 2024 | $3,160 | $88,870 | $27,370 | $61,500 |
| 2023 | $3,160 | $88,870 | $27,370 | $61,500 |
| 2022 | $2,310 | $64,160 | $22,890 | $41,270 |
| 2021 | $2,315 | $64,160 | $22,890 | $41,270 |
| 2020 | $2,320 | $64,160 | $22,890 | $41,270 |
| 2019 | $2,327 | $57,970 | $21,460 | $36,510 |
| 2018 | $2,341 | $57,970 | $21,460 | $36,510 |
| 2017 | $2,327 | $57,970 | $21,460 | $36,510 |
| 2016 | $2,502 | $55,580 | $19,530 | $36,050 |
| 2015 | $2,499 | $55,580 | $19,530 | $36,050 |
| 2014 | $2,491 | $55,580 | $19,530 | $36,050 |
| 2013 | $2,084 | $55,580 | $19,530 | $36,050 |
Source: Public Records
Map
Nearby Homes
- 2693 Mahan Denman Rd NW
- 475 Greenville Rd NW
- 2494 Mahan Denman Rd NW
- 5634 N Park Ave
- 634 Bristol Champion Townline Rd NE
- 398 Bristol Champion Townline Rd NW
- 288 Bristol Champion NE
- 6102 Corey Hunt Rd
- 2271 Peck Leach Rd
- 7434 Fenton Rd NW
- 625 Bristol Champion Townline Rd NW
- 5294 Cottage Dr
- 4220 N Park Ave
- 0 Shaffer Rd NW
- 722 Airport Rd NW
- 6388 Brianna Way NW
- 6227 Mahoning Ave NW
- 27 Danbury Ct NW
- Shafer Road North W Unit LotWP001
- 6050 Shaffer Rd NW
- 6175 Thompson Clark Rd
- 6215 Thompson Clark Rd
- 6192 Thompson Clark Rd
- 6200 Thompson Clark Rd
- 6172 Thompson Clark Rd
- 6229 Thompson Clark Rd
- 6146 Thompson Clark Rd
- 6248 Thompson Clark Rd
- 6275 Thompson Clark Rd
- 6108 Thompson Clark Rd
- 6293 Thompson Clark Rd
- 6300 Thompson Clark Rd
- 6080 Thompson Clark Rd
- 6060 Thompson Clark Rd
- 6323 Thompson Clark Rd
- 959 State Route 88
- 6050 Thompson Clark Rd
- 939 Greenville Rd
- 939 State Route 88
- 905 State Route 88