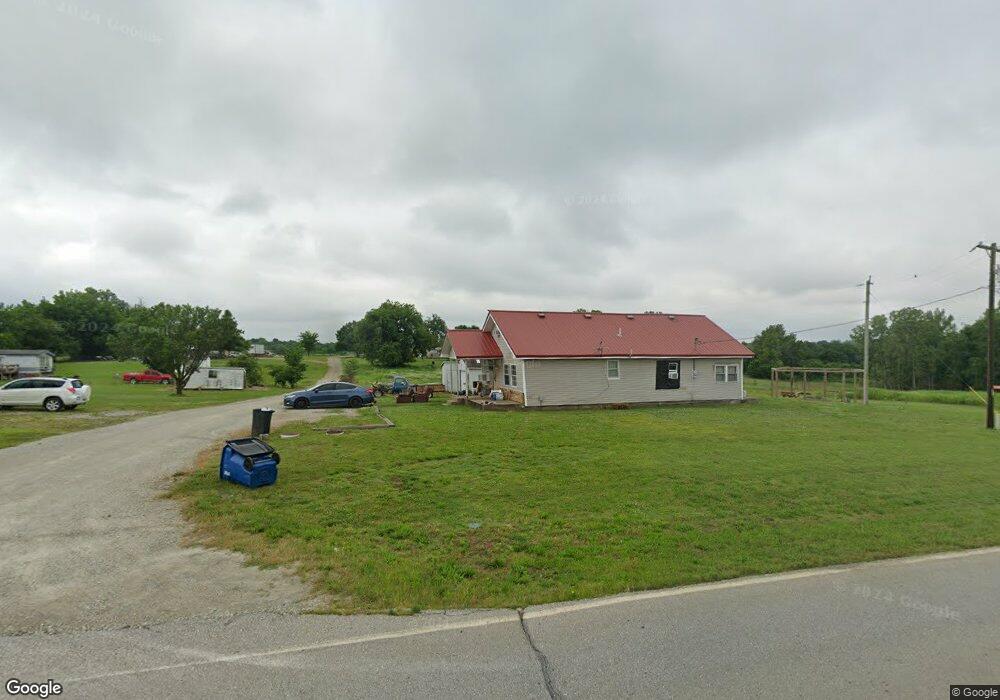
61991 E 50 Rd Quapaw, OK 74363
Estimated Value: $114,000 - $259,000
3
Beds
2
Baths
1,496
Sq Ft
$102/Sq Ft
Est. Value
About This Home
This home is located at 61991 E 50 Rd, Quapaw, OK 74363 and is currently estimated at $153,251, approximately $102 per square foot. 61991 E 50 Rd is a home located in Ottawa County with nearby schools including Quapaw Elementary School, Quapaw Middle School, and Quapaw High School.
Ownership History
Date
Name
Owned For
Owner Type
Purchase Details
Closed on
Jan 29, 2010
Sold by
Davis Wesley and Davis Linda
Bought by
Stanley Daniel M and Stanley Jamie R
Current Estimated Value
Home Financials for this Owner
Home Financials are based on the most recent Mortgage that was taken out on this home.
Original Mortgage
$71,298
Outstanding Balance
$46,764
Interest Rate
4.93%
Mortgage Type
New Conventional
Estimated Equity
$106,487
Purchase Details
Closed on
May 5, 1997
Bought by
Davis Wesley and Davis Eby,Linda
Purchase Details
Closed on
Apr 24, 1997
Bought by
Daylight Jess
Create a Home Valuation Report for This Property
The Home Valuation Report is an in-depth analysis detailing your home's value as well as a comparison with similar homes in the area
Purchase History
| Date | Buyer | Sale Price | Title Company |
|---|---|---|---|
| Stanley Daniel M | $70,000 | None Available | |
| Davis Wesley | $9,000 | -- | |
| Daylight Jess | -- | -- |
Source: Public Records
Mortgage History
| Date | Status | Borrower | Loan Amount |
|---|---|---|---|
| Open | Stanley Daniel M | $71,298 |
Source: Public Records
Tax History
| Year | Tax Paid | Tax Assessment Tax Assessment Total Assessment is a certain percentage of the fair market value that is determined by local assessors to be the total taxable value of land and additions on the property. | Land | Improvement |
|---|---|---|---|---|
| 2025 | $623 | $8,529 | $1,026 | $7,503 |
| 2024 | $603 | $8,280 | $1,026 | $7,254 |
| 2023 | $603 | $8,039 | $1,026 | $7,013 |
| 2022 | $578 | $7,805 | $1,026 | $6,779 |
| 2021 | $468 | $7,578 | $1,026 | $6,552 |
| 2020 | $452 | $7,357 | $1,026 | $6,331 |
| 2019 | $496 | $7,977 | $1,026 | $6,951 |
| 2018 | $496 | $7,977 | $1,026 | $6,951 |
| 2017 | $496 | $7,977 | $1,026 | $6,951 |
| 2016 | $513 | $8,210 | $1,026 | $7,184 |
| 2015 | $144 | $2,107 | $437 | $1,670 |
| 2014 | $497 | $7,980 | $1,596 | $6,384 |
Source: Public Records
Map
Nearby Homes
Your Personal Tour Guide
Ask me questions while you tour the home.