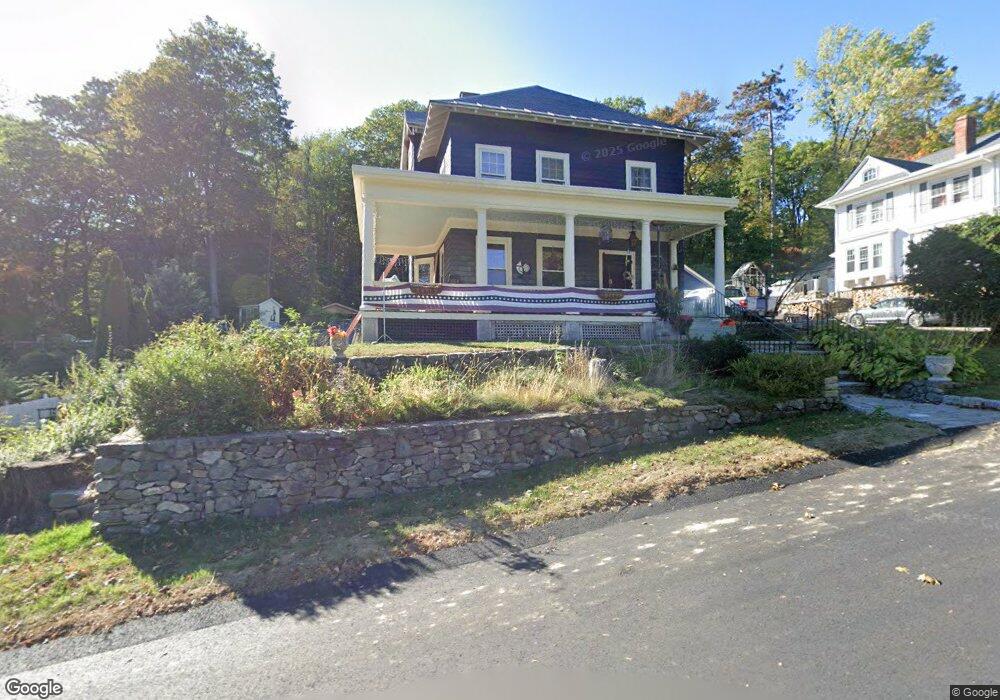
62 Bond St Fitchburg, MA 01420
Estimated Value: $499,000 - $545,000
4
Beds
3
Baths
2,592
Sq Ft
$201/Sq Ft
Est. Value
About This Home
This home is located at 62 Bond St, Fitchburg, MA 01420 and is currently estimated at $521,255, approximately $201 per square foot. 62 Bond St is a home located in Worcester County with nearby schools including Crocker Elementary School, South Street Elementary School, and Reingold Elementary School.
Ownership History
Date
Name
Owned For
Owner Type
Purchase Details
Closed on
May 28, 1999
Sold by
Christ Church Parish
Bought by
Sandrelli David D and Sandrelli Lisa M
Current Estimated Value
Purchase Details
Closed on
Nov 27, 1992
Sold by
Russell Carl A and Russell Margaret
Bought by
Parish Christ Church
Purchase Details
Closed on
Jun 15, 1988
Sold by
Parish Of Christ
Bought by
Russell Carl A
Create a Home Valuation Report for This Property
The Home Valuation Report is an in-depth analysis detailing your home's value as well as a comparison with similar homes in the area
Home Values in the Area
Average Home Value in this Area
Purchase History
| Date | Buyer | Sale Price | Title Company |
|---|---|---|---|
| Sandrelli David D | $135,000 | -- | |
| Parish Christ Church | $136,575 | -- | |
| Russell Carl A | $140,000 | -- |
Source: Public Records
Mortgage History
| Date | Status | Borrower | Loan Amount |
|---|---|---|---|
| Closed | Russell Carl A | $153,500 | |
| Closed | Russell Carl A | $150,000 | |
| Closed | Russell Carl A | $150,000 |
Source: Public Records
Tax History Compared to Growth
Tax History
| Year | Tax Paid | Tax Assessment Tax Assessment Total Assessment is a certain percentage of the fair market value that is determined by local assessors to be the total taxable value of land and additions on the property. | Land | Improvement |
|---|---|---|---|---|
| 2025 | $63 | $465,000 | $114,000 | $351,000 |
| 2024 | $6,448 | $435,400 | $71,100 | $364,300 |
| 2023 | $6,325 | $394,800 | $61,300 | $333,500 |
| 2022 | $5,926 | $336,500 | $55,700 | $280,800 |
| 2021 | $6,036 | $317,200 | $53,000 | $264,200 |
| 2020 | $5,885 | $298,600 | $50,200 | $248,400 |
| 2019 | $5,747 | $280,500 | $65,500 | $215,000 |
| 2018 | $4,797 | $266,600 | $64,100 | $202,500 |
| 2017 | $5,244 | $244,000 | $61,300 | $182,700 |
| 2016 | $4,908 | $231,200 | $59,900 | $171,300 |
| 2015 | $4,758 | $230,100 | $61,300 | $168,800 |
| 2014 | $4,563 | $230,100 | $61,300 | $168,800 |
Source: Public Records
Map
Nearby Homes
- 59 Arlington St
- 47 Arlington St
- 58 Arlington St Unit 60
- 39 Arlington St
- 13-15 Chestnut St
- 90 Mechanic St
- 151 Mechanic St
- 33-35 Omena Place
- 205-207 High St
- 68 Marshall St
- 195 Marshall St
- 7 Valleyview Ct Unit 3
- 62 Grove St
- 230 Kimball St
- 11 Beech Street Ln
- 5 Jay St
- 58 Oliver St
- 34 Garnet St
- 58 (A B) Oliver St
- 79 Beech St