62 Bowman St Westborough, MA 01581
Estimated Value: $635,000 - $693,000
4
Beds
3
Baths
1,244
Sq Ft
$540/Sq Ft
Est. Value
About This Home
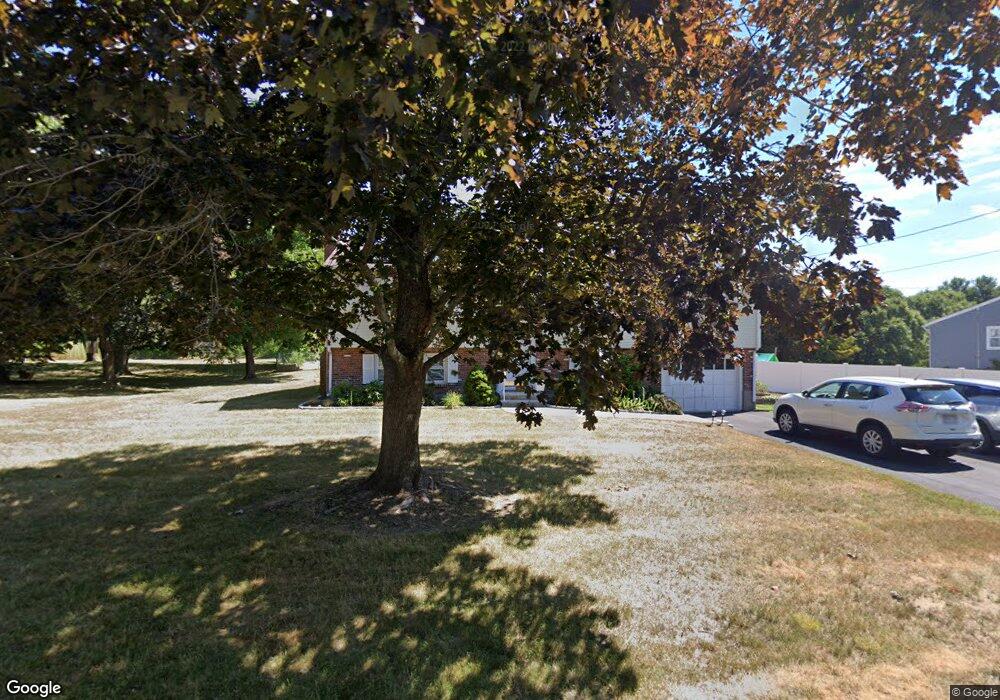
This home is located at 62 Bowman St, Westborough, MA 01581 and is currently estimated at $671,985, approximately $540 per square foot. 62 Bowman St is a home located in Worcester County with nearby schools including Westborough High School, Ebridge Montessori School, and Westboro Knowledge Beginnings.
Ownership History
Date
Name
Owned For
Owner Type
Purchase Details
Closed on
Aug 16, 2010
Sold by
Oneill James A and Garbani Kirsten A
Bought by
Garbani Kirsten A and Scott Stephen
Current Estimated Value
Home Financials for this Owner
Home Financials are based on the most recent Mortgage that was taken out on this home.
Original Mortgage
$270,400
Outstanding Balance
$179,572
Interest Rate
4.63%
Mortgage Type
Purchase Money Mortgage
Estimated Equity
$492,413
Purchase Details
Closed on
Dec 28, 1999
Sold by
Bolen Carl H and Bolen Marjorie A
Bought by
Oneill James A and Garbani Kristen A
Home Financials for this Owner
Home Financials are based on the most recent Mortgage that was taken out on this home.
Original Mortgage
$193,900
Interest Rate
7.61%
Mortgage Type
Purchase Money Mortgage
Create a Home Valuation Report for This Property
The Home Valuation Report is an in-depth analysis detailing your home's value as well as a comparison with similar homes in the area
Home Values in the Area
Average Home Value in this Area
Purchase History
| Date | Buyer | Sale Price | Title Company |
|---|---|---|---|
| Garbani Kirsten A | -- | -- | |
| Oneill James A | $199,900 | -- |
Source: Public Records
Mortgage History
| Date | Status | Borrower | Loan Amount |
|---|---|---|---|
| Open | Garbani Kirsten A | $270,400 | |
| Previous Owner | Oneill James A | $197,200 | |
| Previous Owner | Oneill James A | $193,900 | |
| Previous Owner | Oneill James A | $104,000 |
Source: Public Records
Tax History Compared to Growth
Tax History
| Year | Tax Paid | Tax Assessment Tax Assessment Total Assessment is a certain percentage of the fair market value that is determined by local assessors to be the total taxable value of land and additions on the property. | Land | Improvement |
|---|---|---|---|---|
| 2025 | $8,665 | $531,900 | $313,100 | $218,800 |
| 2024 | $7,923 | $482,800 | $291,200 | $191,600 |
| 2023 | $7,861 | $466,800 | $276,000 | $190,800 |
| 2022 | $7,304 | $395,000 | $219,400 | $175,600 |
| 2021 | $3,208 | $371,000 | $195,400 | $175,600 |
| 2020 | $1,672 | $371,200 | $203,400 | $167,800 |
| 2019 | $6,821 | $352,900 | $203,400 | $149,500 |
| 2018 | $6,593 | $323,700 | $189,500 | $134,200 |
| 2017 | $5,762 | $323,700 | $189,500 | $134,200 |
| 2016 | $5,413 | $304,600 | $179,500 | $125,100 |
| 2015 | $5,412 | $291,100 | $179,500 | $111,600 |
Source: Public Records
Map
Nearby Homes