Estimated Value: $100,780 - $163,000
3
Beds
1
Bath
1,035
Sq Ft
$127/Sq Ft
Est. Value
About This Home
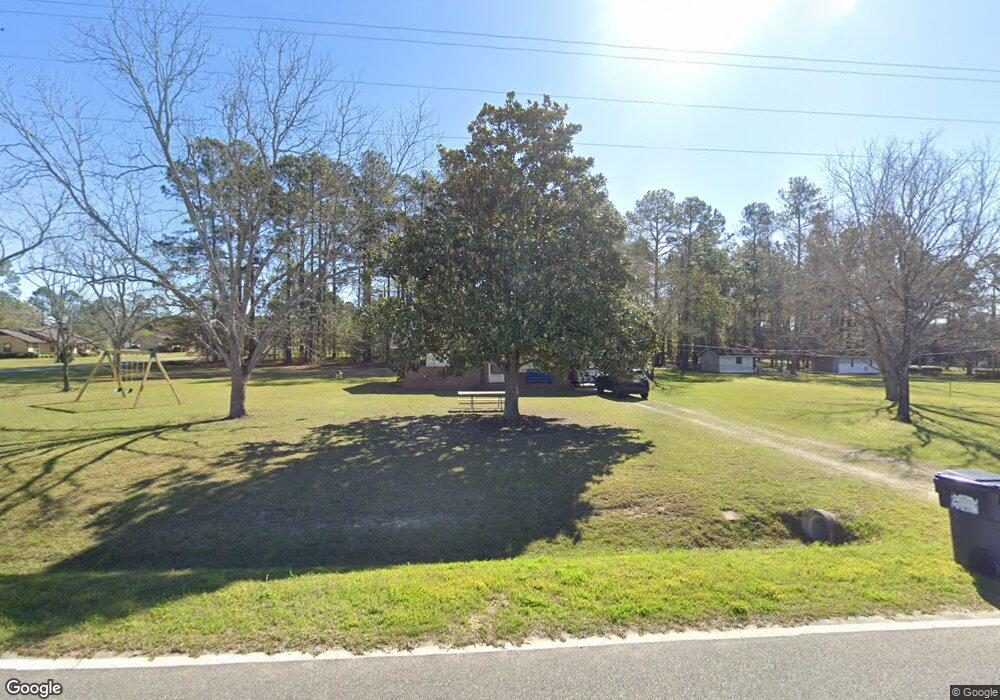
This home is located at 62 Brad St, Lenox, GA 31637 and is currently estimated at $131,695, approximately $127 per square foot. 62 Brad St is a home located in Cook County with nearby schools including Cook Primary School, Cook Elementary School, and Cook County Middle School.
Ownership History
Date
Name
Owned For
Owner Type
Purchase Details
Closed on
Jan 10, 2025
Sold by
Pitts Justin Tyler
Bought by
Pitts Angelika Melton and Pitts Justin Tyler
Current Estimated Value
Home Financials for this Owner
Home Financials are based on the most recent Mortgage that was taken out on this home.
Original Mortgage
$136,363
Outstanding Balance
$134,738
Interest Rate
6.6%
Mortgage Type
New Conventional
Estimated Equity
-$3,043
Purchase Details
Closed on
Dec 5, 2019
Sold by
Mason Darrell L
Bought by
Mason Darrell L and Mason Ruth Ball
Purchase Details
Closed on
Dec 21, 2012
Sold by
Pate Clayton
Bought by
Mason Darrell L
Home Financials for this Owner
Home Financials are based on the most recent Mortgage that was taken out on this home.
Original Mortgage
$54,900
Interest Rate
2.66%
Mortgage Type
New Conventional
Create a Home Valuation Report for This Property
The Home Valuation Report is an in-depth analysis detailing your home's value as well as a comparison with similar homes in the area
Purchase History
| Date | Buyer | Sale Price | Title Company |
|---|---|---|---|
| Pitts Angelika Melton | -- | -- | |
| Pitts Justin Tyler | $135,000 | -- | |
| Mason Darrell L | -- | -- | |
| Mason Darrell L | $61,000 | -- |
Source: Public Records
Mortgage History
| Date | Status | Borrower | Loan Amount |
|---|---|---|---|
| Open | Pitts Justin Tyler | $136,363 | |
| Previous Owner | Mason Darrell L | $54,900 |
Source: Public Records
Tax History
| Year | Tax Paid | Tax Assessment Tax Assessment Total Assessment is a certain percentage of the fair market value that is determined by local assessors to be the total taxable value of land and additions on the property. | Land | Improvement |
|---|---|---|---|---|
| 2025 | $1,073 | $30,768 | $6,328 | $24,440 |
| 2024 | $835 | $31,013 | $5,003 | $26,010 |
| 2023 | $722 | $26,797 | $4,467 | $22,330 |
| 2022 | $722 | $26,797 | $4,467 | $22,330 |
| 2021 | $654 | $22,639 | $4,467 | $18,172 |
| 2020 | $654 | $22,639 | $4,467 | $18,172 |
| 2019 | $654 | $22,639 | $4,467 | $18,172 |
| 2018 | $655 | $22,639 | $4,467 | $18,172 |
| 2017 | $655 | $22,639 | $4,467 | $18,172 |
| 2016 | $656 | $22,639 | $4,467 | $18,172 |
| 2015 | $657 | $22,638 | $4,467 | $18,172 |
| 2014 | $658 | $22,638 | $4,467 | $18,172 |
| 2013 | -- | $22,638 | $4,466 | $18,171 |
Source: Public Records
Map
Nearby Homes
- 83 W Gray Ave
- 326 N Robinson St
- 320 E Central Ave
- 1629 Baker Sawmill Rd
- 35 Lake Larry Dr
- 14268 Georgia 125
- 0 Omega-Eldorado Rd
- 106 S Goodman St
- 3332 Ellenton Norman Park Rd
- 0 E 0 Hwy 125 S
- 103 Bryan St
- 134 Brandy Ct
- 284 Barrett Rd
- 2696 Woodland Dr
- 8422 Massee Post Rd
- 91 Apple Ln
- 1702 Jimmy St
- 1607 Jimmy St
- 2603 Dianne St
- 0 S Us Hwy 41 Lee Ball Rd Unit 134993
Your Personal Tour Guide
Ask me questions while you tour the home.