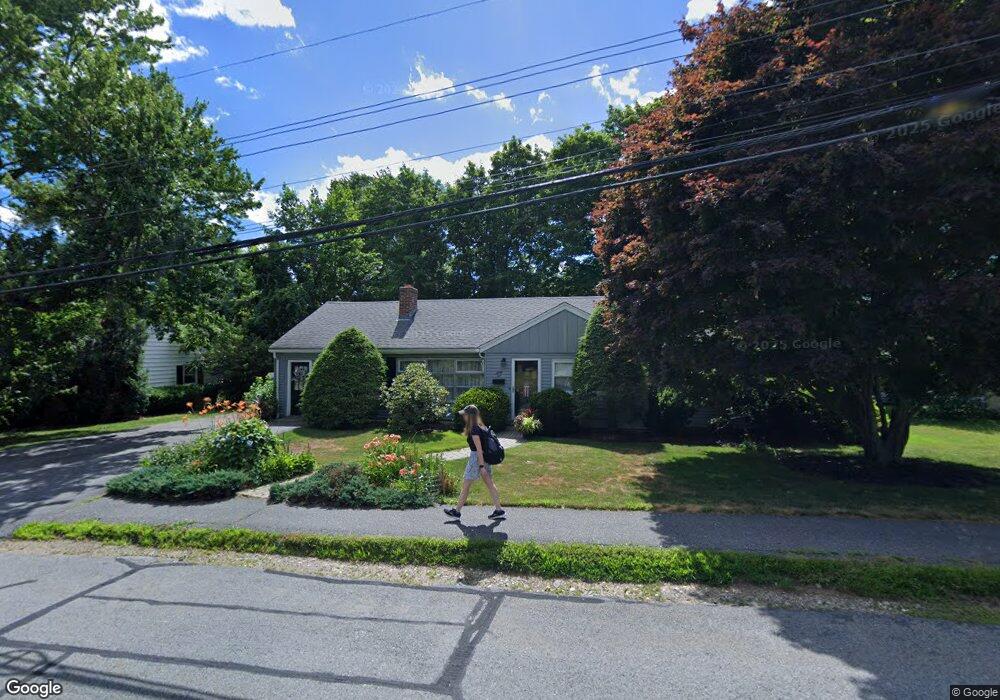
62 Charles St Natick, MA 01760
Estimated Value: $824,080 - $1,083,000
3
Beds
3
Baths
1,902
Sq Ft
$493/Sq Ft
Est. Value
About This Home
This home is located at 62 Charles St, Natick, MA 01760 and is currently estimated at $938,020, approximately $493 per square foot. 62 Charles St is a home located in Middlesex County with nearby schools including Natick High School, Wilson Middle School, and Bennett-Hemenway (Ben-Hem) Elementary School.
Ownership History
Date
Name
Owned For
Owner Type
Purchase Details
Closed on
Jun 25, 1993
Sold by
Nannini Anthony M and Nannini Gail C
Bought by
Lancaster Kimberly I and Lancaster John R
Current Estimated Value
Home Financials for this Owner
Home Financials are based on the most recent Mortgage that was taken out on this home.
Original Mortgage
$134,550
Interest Rate
7.37%
Mortgage Type
Purchase Money Mortgage
Purchase Details
Closed on
Aug 12, 1988
Sold by
Peters Arlene M
Bought by
Nannini Anthony M
Home Financials for this Owner
Home Financials are based on the most recent Mortgage that was taken out on this home.
Original Mortgage
$117,000
Interest Rate
10.34%
Mortgage Type
Purchase Money Mortgage
Create a Home Valuation Report for This Property
The Home Valuation Report is an in-depth analysis detailing your home's value as well as a comparison with similar homes in the area
Home Values in the Area
Average Home Value in this Area
Purchase History
| Date | Buyer | Sale Price | Title Company |
|---|---|---|---|
| Lancaster Kimberly I | $149,500 | -- | |
| Nannini Anthony M | $158,500 | -- |
Source: Public Records
Mortgage History
| Date | Status | Borrower | Loan Amount |
|---|---|---|---|
| Open | Nannini Anthony M | $10,000 | |
| Closed | Nannini Anthony M | $134,550 | |
| Previous Owner | Nannini Anthony M | $118,000 | |
| Previous Owner | Nannini Anthony M | $117,000 |
Source: Public Records
Tax History Compared to Growth
Tax History
| Year | Tax Paid | Tax Assessment Tax Assessment Total Assessment is a certain percentage of the fair market value that is determined by local assessors to be the total taxable value of land and additions on the property. | Land | Improvement |
|---|---|---|---|---|
| 2025 | $7,961 | $665,600 | $450,200 | $215,400 |
| 2024 | $7,681 | $626,500 | $425,200 | $201,300 |
| 2023 | $7,540 | $596,500 | $400,100 | $196,400 |
| 2022 | $7,314 | $548,300 | $365,100 | $183,200 |
| 2021 | $7,038 | $517,100 | $345,100 | $172,000 |
| 2020 | $6,834 | $502,100 | $330,100 | $172,000 |
| 2019 | $7,765 | $502,100 | $330,100 | $172,000 |
| 2018 | $5,759 | $441,300 | $300,100 | $141,200 |
| 2017 | $5,125 | $379,900 | $265,100 | $114,800 |
| 2016 | $4,938 | $363,900 | $250,100 | $113,800 |
| 2015 | $4,793 | $346,800 | $250,100 | $96,700 |
Source: Public Records
Map
Nearby Homes
- 7 Jackson Ct Unit B
- 12 Linden St
- 287 Bacon St
- 293 Bacon St Unit A
- 58 N Main St Unit 304
- 8 Flynn St
- 8 Stanley St
- 34 N Main St Unit 2
- 4 Willow St
- 2 Yuba Place
- 28 Walnut St
- 26 Walnut St
- 13 Sheffield Rd
- 20 Florence St Unit B
- 7 Sheffield Rd
- 16 Harvard St
- 25 Sawin St
- 4 Richard Rd
- 25 Irving Rd
- 49 Summer St