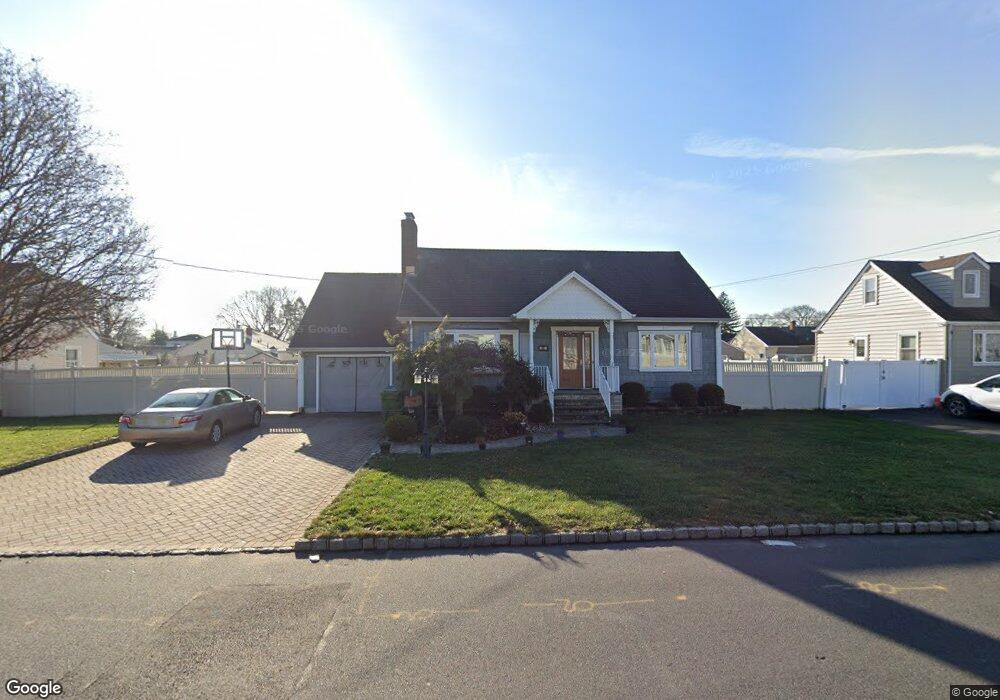
62 Craig St Edison, NJ 08817
Estimated Value: $511,811 - $719,000
--
Bed
--
Bath
1,272
Sq Ft
$451/Sq Ft
Est. Value
About This Home
This home is located at 62 Craig St, Edison, NJ 08817 and is currently estimated at $574,203, approximately $451 per square foot. 62 Craig St is a home located in Middlesex County with nearby schools including Lindeneau Elementary School, Herbert Hoover Middle School, and Edison High School.
Ownership History
Date
Name
Owned For
Owner Type
Purchase Details
Closed on
Oct 9, 2020
Sold by
Patel Rekhankkumar and Patel Jaymisha
Bought by
Patel Rekhankkumar and Patel Jaymisha
Current Estimated Value
Purchase Details
Closed on
Sep 18, 2015
Sold by
Mcbriarty Michael and Mcbriarty Barbara R
Bought by
Patel Rekhankkumar and Patel Jaymisha
Home Financials for this Owner
Home Financials are based on the most recent Mortgage that was taken out on this home.
Original Mortgage
$369,000
Interest Rate
3.95%
Mortgage Type
New Conventional
Purchase Details
Closed on
Apr 29, 2008
Sold by
Blauvelt Barbara E
Bought by
Mcbriarty Michael and Mcbriarty Barbara R
Create a Home Valuation Report for This Property
The Home Valuation Report is an in-depth analysis detailing your home's value as well as a comparison with similar homes in the area
Home Values in the Area
Average Home Value in this Area
Purchase History
| Date | Buyer | Sale Price | Title Company |
|---|---|---|---|
| Patel Rekhankkumar | -- | None Listed On Document | |
| Patel Rekhankkumar | $10,000 | Golden Title Agency | |
| Mcbriarty Michael | -- | None Available |
Source: Public Records
Mortgage History
| Date | Status | Borrower | Loan Amount |
|---|---|---|---|
| Previous Owner | Patel Rekhankkumar | $369,000 | |
| Previous Owner | Patel Rekhankkumar | $369,000 |
Source: Public Records
Tax History Compared to Growth
Tax History
| Year | Tax Paid | Tax Assessment Tax Assessment Total Assessment is a certain percentage of the fair market value that is determined by local assessors to be the total taxable value of land and additions on the property. | Land | Improvement |
|---|---|---|---|---|
| 2025 | $10,043 | $168,700 | $90,000 | $78,700 |
| 2024 | $9,989 | $168,700 | $90,000 | $78,700 |
| 2023 | $9,989 | $168,700 | $90,000 | $78,700 |
| 2022 | $9,992 | $168,700 | $90,000 | $78,700 |
| 2021 | $9,867 | $168,700 | $90,000 | $78,700 |
| 2020 | $9,867 | $168,700 | $90,000 | $78,700 |
| 2019 | $9,494 | $168,700 | $90,000 | $78,700 |
| 2018 | $9,265 | $168,700 | $90,000 | $78,700 |
| 2017 | $9,069 | $168,700 | $90,000 | $78,700 |
| 2016 | $8,616 | $163,300 | $90,000 | $73,300 |
| 2015 | $8,286 | $163,300 | $90,000 | $73,300 |
| 2014 | $8,044 | $163,300 | $90,000 | $73,300 |
Source: Public Records
Map
Nearby Homes
- 63 Plainfield Ave
- 16 Chapel St
- 117 Old Post Rd
- 12 Old Post Rd
- 45 Loring Ave
- 75 Jefferson Blvd
- 13 Putnam Ave
- 113 Stony Rd
- 8 Germantown Ave
- 8 Germantown Ave Unit 1
- 59 Oakland Ave
- 92 Lake View Blvd
- 15 Bradley Dr
- 206 Plainfield Ave
- 40 Cambridge Rd
- 57 Columbus Ave
- 134 Lake View Blvd
- 22 Trenton Ave
- 223 Plainfield Ave
- 228 Loring Ave