62 E Bluff Rd Unit 21C Ashland, MA 01721
Estimated Value: $484,000 - $551,000
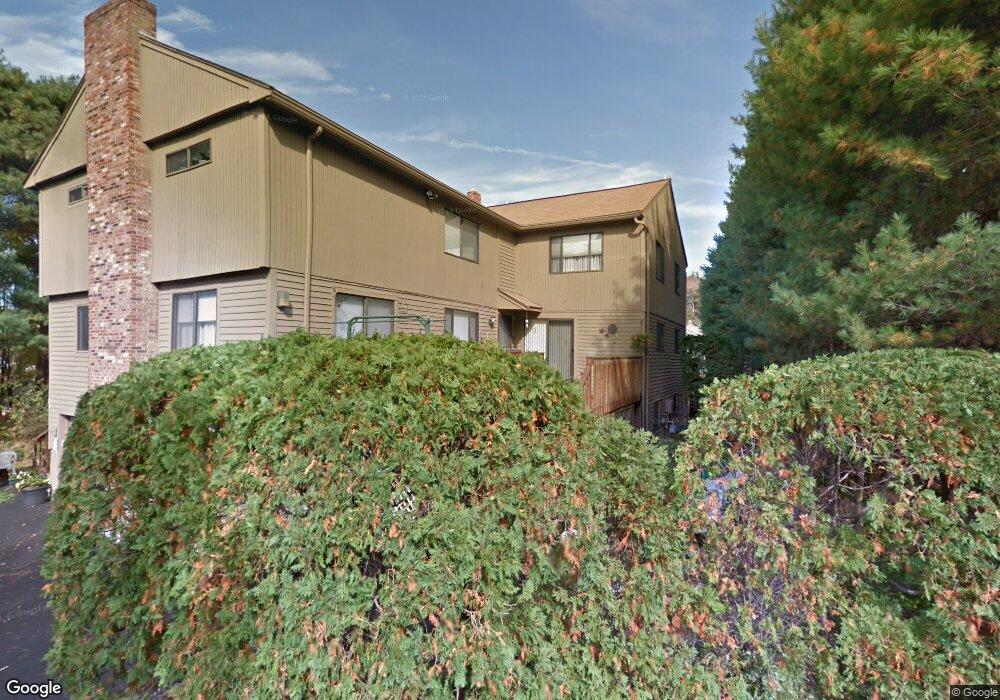
About This Home
This home is located at 62 E Bluff Rd Unit 21C, Ashland, MA 01721 and is currently estimated at $504,900, approximately $309 per square foot. 62 E Bluff Rd Unit 21C is a home located in Middlesex County with nearby schools including William Pittaway Elementary School, Henry E. Warren Elementary School, and David Mindess Elementary School.
Ownership History
We collect this data history from publicly available records. To have your information removed, we recommend requesting removal directly through your county’s website.
Purchase Details
Home Financials for this Owner
Home Financials are based on the most recent Mortgage that was taken out on this home.Purchase Details
Home Financials for this Owner
Home Financials are based on the most recent Mortgage that was taken out on this home.Home Values in the Area
Average Home Value in this Area
Purchase History
We collect this data history from publicly available records. To have your information removed, we recommend requesting removal directly through your county’s website.
| Date | Buyer | Sale Price | Title Company |
|---|---|---|---|
| -- | None Available | ||
| $138,600 | -- |
Mortgage History
We collect this data history from publicly available records. To have your information removed, we recommend requesting removal directly through your county’s website.
| Date | Status | Borrower | Loan Amount |
|---|---|---|---|
| Open | $201,000 | ||
| Previous Owner | $190,000 | ||
| Previous Owner | $124,740 | ||
| Previous Owner | $30,000 |
Tax History
We collect this data history from publicly available records. To have your information removed, we recommend requesting removal directly through your county’s website.
| Year | Tax Paid | Tax Assessment Tax Assessment Total Assessment is a certain percentage of the fair market value that is determined by local assessors to be the total taxable value of land and additions on the property. | Land | Improvement |
|---|---|---|---|---|
| 2025 | $5,849 | $458,000 | $0 | $458,000 |
| 2024 | $5,418 | $409,200 | $0 | $409,200 |
| 2023 | $5,390 | $391,400 | $0 | $391,400 |
| 2022 | $5,491 | $345,800 | $0 | $345,800 |
| 2021 | $5,196 | $326,200 | $0 | $326,200 |
| 2020 | $4,903 | $303,400 | $0 | $303,400 |
| 2019 | $4,726 | $290,300 | $0 | $290,300 |
| 2018 | $4,496 | $270,700 | $0 | $270,700 |
| 2017 | $4,248 | $254,400 | $0 | $254,400 |
| 2016 | $4,160 | $244,700 | $0 | $244,700 |
| 2015 | $4,063 | $234,864 | $0 | $234,864 |
| 2014 | $3,914 | $225,100 | $0 | $225,100 |
Map
- 89 Leland Farm Rd Unit 89
- 30 Mountain Gate Rd
- 146 Mountain Gate Rd
- 25 Nickerson Rd
- 217 Meeting House Path
- 233 Meeting House Path Unit 233
- 107 Arrowhead Cir
- 7 Hundred Oaks Ln
- 9 Running Brook Cir
- 3 Shady Hollow Path
- 85 Old Cart Path
- 81 Arrowhead Cir
- 147 Turner Rd Unit 73
- 152 Turner Rd Unit 52
- 152 Turner Rd Unit 3
- 73 Half Crown Cir
- 7 Adams Ln Unit 7
- 9 Adams Ln Unit 9
- 156 Algonquin Trail
- 254 Captain Eames Cir
- 22 E Bluff Rd
- 62 E Bluff Rd
- 60 E Bluff Rd
- 20 E Bluff Rd
- 20 E Bluff Rd Unit 20
- 60 E Bluff Rd Unit 60
- 14 E Bluff Rd
- 54 E Bluff Rd
- 52 E Bluff Rd
- 12 E Bluff Rd
- 52 E Bluff Rd Unit 52
- 14 E Bluff Rd Unit 14
- 18 E Bluff Rd
- 16 E Bluff Rd
- 16 E Bluff Rd Unit 16
- 30 E Bluff Rd
- 28 E Bluff Rd
- 26 E Bluff Rd
- 24 E Bluff Rd
- 40 Spyglass Hill Dr
Ask me questions while you tour the home.