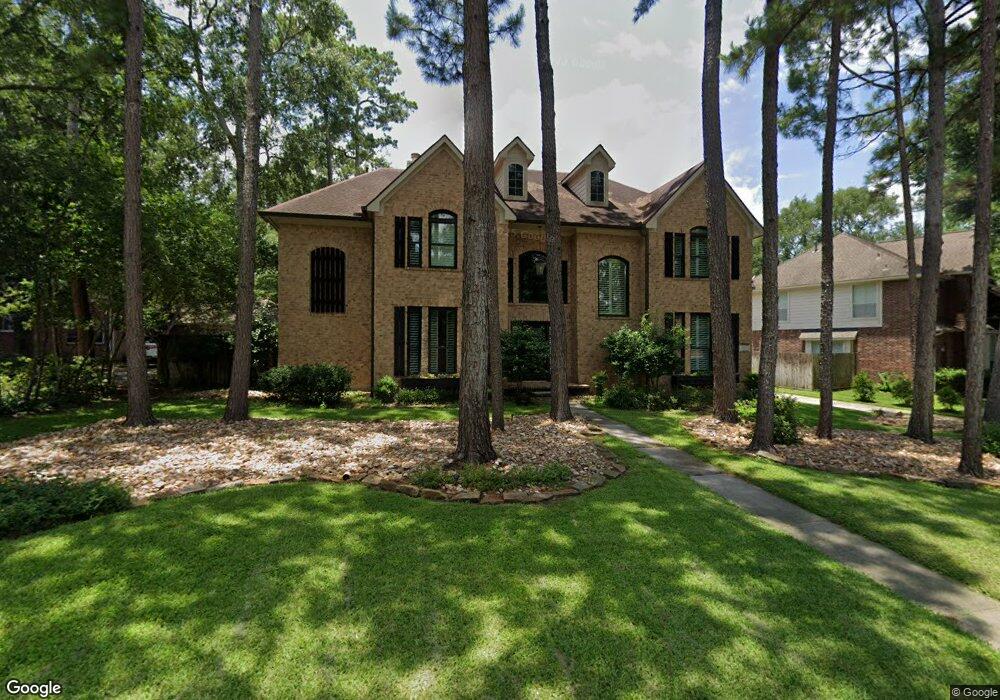
62 E Green Gables Cir Spring, TX 77382
Cochran's Crossing NeighborhoodEstimated Value: $696,000 - $741,000
5
Beds
4
Baths
3,638
Sq Ft
$200/Sq Ft
Est. Value
About This Home
This home is located at 62 E Green Gables Cir, Spring, TX 77382 and is currently estimated at $727,012, approximately $199 per square foot. 62 E Green Gables Cir is a home located in Montgomery County with nearby schools including Bush Elementary School, Mitchell Intermediate School, and McCullough Junior High School.
Ownership History
Date
Name
Owned For
Owner Type
Purchase Details
Closed on
Feb 21, 2013
Sold by
Gutierrez Mario and Gutierrez Cheryl M
Bought by
Mckenna Patrick and Boisch Mckenna Eva
Current Estimated Value
Home Financials for this Owner
Home Financials are based on the most recent Mortgage that was taken out on this home.
Original Mortgage
$284,250
Outstanding Balance
$198,890
Interest Rate
3.43%
Mortgage Type
New Conventional
Estimated Equity
$528,122
Purchase Details
Closed on
Jul 26, 1996
Sold by
Dr Horton - Emerald Builders Ltd
Bought by
Mckenna Patrick and Eva Boisch-
Home Financials for this Owner
Home Financials are based on the most recent Mortgage that was taken out on this home.
Original Mortgage
$130,000
Interest Rate
7.37%
Purchase Details
Closed on
Jan 25, 1996
Sold by
Woodlands Land Dev Lp
Bought by
Mckenna Patrick and Eva Boisch-
Create a Home Valuation Report for This Property
The Home Valuation Report is an in-depth analysis detailing your home's value as well as a comparison with similar homes in the area
Home Values in the Area
Average Home Value in this Area
Purchase History
| Date | Buyer | Sale Price | Title Company |
|---|---|---|---|
| Mckenna Patrick | -- | First American Title | |
| Mckenna Patrick | -- | -- | |
| Gutierrez Mario | -- | -- | |
| Mckenna Patrick | -- | -- |
Source: Public Records
Mortgage History
| Date | Status | Borrower | Loan Amount |
|---|---|---|---|
| Open | Mckenna Patrick | $284,250 | |
| Previous Owner | Gutierrez Mario | $130,000 |
Source: Public Records
Tax History
| Year | Tax Paid | Tax Assessment Tax Assessment Total Assessment is a certain percentage of the fair market value that is determined by local assessors to be the total taxable value of land and additions on the property. | Land | Improvement |
|---|---|---|---|---|
| 2025 | $10,037 | $683,073 | $120,000 | $563,073 |
| 2024 | $9,101 | $649,770 | -- | -- |
| 2023 | $9,101 | $590,700 | $120,000 | $489,090 |
| 2022 | $10,884 | $537,000 | $120,000 | $471,770 |
| 2021 | $10,648 | $488,180 | $45,180 | $443,000 |
| 2020 | $11,231 | $485,510 | $45,180 | $440,330 |
| 2019 | $10,605 | $444,320 | $45,180 | $399,140 |
| 2018 | $9,034 | $419,250 | $45,180 | $374,070 |
| 2017 | $10,583 | $438,050 | $45,180 | $392,870 |
| 2016 | $11,669 | $482,990 | $45,180 | $437,810 |
| 2015 | $9,940 | $458,450 | $45,180 | $427,130 |
| 2014 | $9,940 | $416,770 | $45,180 | $371,590 |
Source: Public Records
Map
Nearby Homes
- 19 Baylark Place
- 82 E Coldbrook Cir
- 43 Meadow Brook Place
- 168 Bristol Bend Cir
- 31 E Amberglow Cir
- 14 S Duskwood Place
- 36 Stone Creek Place
- 27 Summer Haze Cir
- 2 S Duskwood Place
- 71 Summerhaze Cir
- 2 Thundercreek Place
- 14 Valley Oaks Cir
- 38 Wineberry Place
- 75 N Floral Leaf Cir
- 157 E Summerhaze Cir
- 31 Valley Oaks Cir
- 51 Wineberry Place
- 151 Anise Tree Place
- 79 Anise Tree Place
- 6 Thornbush Place
- 66 E Green Gables Cir
- 58 E Green Gables Cir
- 6 Wild Colt Place
- 3 Winrock Place
- 70 E Green Gables Cir
- 54 E Green Gables Cir
- 2 Wild Colt Place
- 2 Baylark Place
- 10 Wild Colt Place
- 2 Winrock Place
- 74 E Green Gables Cir
- 7 Winrock Place
- 50 E Green Gables Cir
- 50 E Green Gables Cir
- 6 Baylark Place
- 3 Wild Colt Place
- 59 E Green Gables Cir
- 14 Wild Colt Place
- 10 Baylark Place
- 78 E Green Gables Cir
Your Personal Tour Guide
Ask me questions while you tour the home.