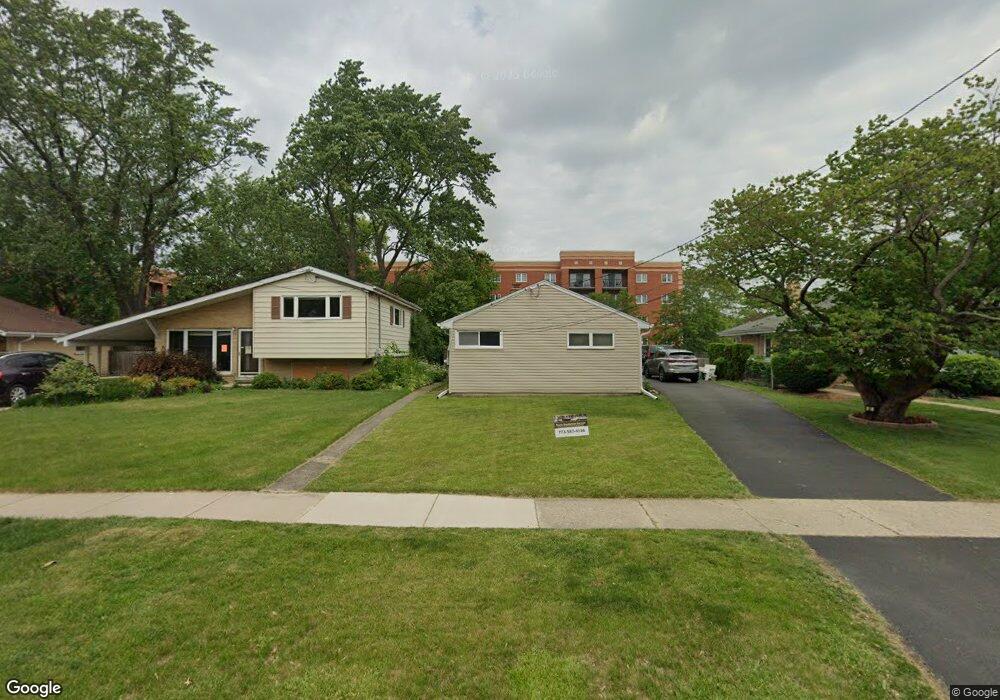
62 E Washington St Palatine, IL 60067
Downtown Palatine NeighborhoodEstimated Value: $334,484 - $346,000
3
Beds
1
Bath
960
Sq Ft
$356/Sq Ft
Est. Value
About This Home
This home is located at 62 E Washington St, Palatine, IL 60067 and is currently estimated at $342,121, approximately $356 per square foot. 62 E Washington St is a home located in Cook County with nearby schools including Stuart R Paddock School, Plum Grove Jr High School, and William Fremd High School.
Ownership History
Date
Name
Owned For
Owner Type
Purchase Details
Closed on
Oct 20, 2000
Sold by
Mazik Peter V
Bought by
White Mark E and White Susan R
Current Estimated Value
Home Financials for this Owner
Home Financials are based on the most recent Mortgage that was taken out on this home.
Original Mortgage
$130,000
Outstanding Balance
$47,206
Interest Rate
7.86%
Estimated Equity
$294,915
Purchase Details
Closed on
May 14, 1999
Sold by
Bokhari Ikram U and Bokhari Naila
Bought by
Mazik Peter V
Home Financials for this Owner
Home Financials are based on the most recent Mortgage that was taken out on this home.
Original Mortgage
$171,000
Interest Rate
7.43%
Mortgage Type
VA
Purchase Details
Closed on
Nov 1, 1994
Sold by
Czajka Joseph J and Czajka Nancy L
Bought by
Bokhari Ikram U and Bokhari Naila
Home Financials for this Owner
Home Financials are based on the most recent Mortgage that was taken out on this home.
Original Mortgage
$146,200
Interest Rate
8.86%
Mortgage Type
VA
Create a Home Valuation Report for This Property
The Home Valuation Report is an in-depth analysis detailing your home's value as well as a comparison with similar homes in the area
Home Values in the Area
Average Home Value in this Area
Purchase History
| Date | Buyer | Sale Price | Title Company |
|---|---|---|---|
| White Mark E | $182,000 | -- | |
| Mazik Peter V | $171,000 | -- | |
| Bokhari Ikram U | $143,500 | Attorneys Natl Title Network |
Source: Public Records
Mortgage History
| Date | Status | Borrower | Loan Amount |
|---|---|---|---|
| Open | White Mark E | $130,000 | |
| Previous Owner | Mazik Peter V | $171,000 | |
| Previous Owner | Bokhari Ikram U | $146,200 |
Source: Public Records
Tax History Compared to Growth
Tax History
| Year | Tax Paid | Tax Assessment Tax Assessment Total Assessment is a certain percentage of the fair market value that is determined by local assessors to be the total taxable value of land and additions on the property. | Land | Improvement |
|---|---|---|---|---|
| 2024 | $5,338 | $24,000 | $4,500 | $19,500 |
| 2023 | $5,110 | $24,000 | $4,500 | $19,500 |
| 2022 | $5,110 | $24,000 | $4,500 | $19,500 |
| 2021 | $4,419 | $19,600 | $2,625 | $16,975 |
| 2020 | $4,484 | $19,600 | $2,625 | $16,975 |
| 2019 | $4,489 | $21,827 | $2,625 | $19,202 |
| 2018 | $6,429 | $24,124 | $2,437 | $21,687 |
| 2017 | $6,326 | $24,124 | $2,437 | $21,687 |
| 2016 | $6,132 | $24,124 | $2,437 | $21,687 |
| 2015 | $4,867 | $18,464 | $2,250 | $16,214 |
| 2014 | $4,825 | $18,464 | $2,250 | $16,214 |
| 2013 | $4,683 | $18,464 | $2,250 | $16,214 |
Source: Public Records
Map
Nearby Homes
- 55 S Hale St Unit 202
- 55 S Hale St Unit 109
- 111 E Palatine Rd
- 3 E Slade St
- 2 E Slade St
- 4 E Slade St
- 24 W Station St Unit 403W
- 104 N Plum Grove Rd Unit 400
- 87 W Station St
- 133 W Palatine Rd Unit 107A
- 50 S Greeley St Unit 204
- 315 Johnson St
- 122 W Helen Rd
- 115 W Helen Rd
- 450 E Palatine Rd
- 241 N Brockway St
- 509 S Plum Grove Rd
- 222 S Maple St
- 223 W Glade Rd
- 418 S Rose St
- 56 E Washington St
- 52 E Washington St
- 106 E Washington St
- 110 E Washington St
- 48 E Washington St
- 59 S Hale St Unit 310
- 59 S Hale St Unit 410
- 59 S Hale St Unit 201
- 59 S Hale St Unit 309
- 59 S Hale St Unit 405
- 59 S Hale St Unit 204
- 59 S Hale St Unit 101
- 59 S Hale St Unit 307
- 59 S Hale St Unit 109
- 59 S Hale St Unit 104
- 59 S Hale St Unit 301
- 59 S Hale St Unit 308
- 59 S Hale St Unit 403
- 59 S Hale St Unit 105
- 59 S Hale St Unit 206