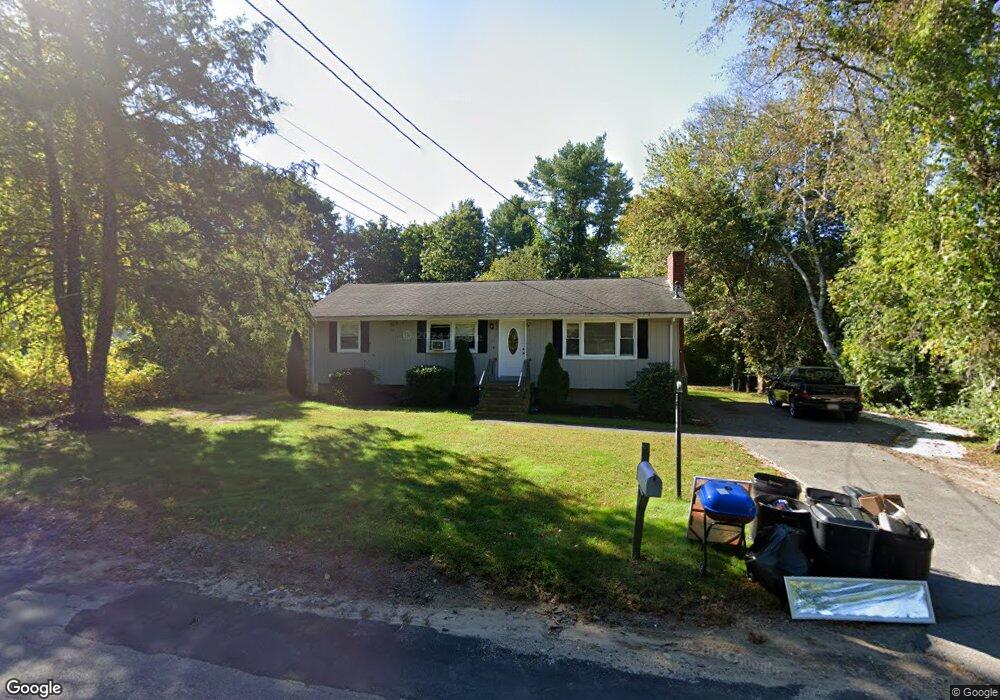
62 Elm St Stoughton, MA 02072
Estimated Value: $548,000 - $675,764
3
Beds
1
Bath
1,252
Sq Ft
$474/Sq Ft
Est. Value
About This Home
This home is located at 62 Elm St, Stoughton, MA 02072 and is currently estimated at $593,941, approximately $474 per square foot. 62 Elm St is a home located in Norfolk County with nearby schools including Helen Hansen Elementary School, O'Donnell Middle School, and Stoughton High School.
Ownership History
Date
Name
Owned For
Owner Type
Purchase Details
Closed on
May 26, 2006
Sold by
Henningsen Jennifer F and Parker Suzanne F
Bought by
Zervas Areti and Zervas George
Current Estimated Value
Home Financials for this Owner
Home Financials are based on the most recent Mortgage that was taken out on this home.
Original Mortgage
$240,000
Outstanding Balance
$140,784
Interest Rate
6.53%
Mortgage Type
Purchase Money Mortgage
Estimated Equity
$453,157
Purchase Details
Closed on
Jan 14, 2005
Sold by
Flad Frichard
Bought by
Flad Frichard and Henningsen Jennifer F
Create a Home Valuation Report for This Property
The Home Valuation Report is an in-depth analysis detailing your home's value as well as a comparison with similar homes in the area
Home Values in the Area
Average Home Value in this Area
Purchase History
| Date | Buyer | Sale Price | Title Company |
|---|---|---|---|
| Zervas Areti | $300,000 | -- | |
| Zervas Areti | $300,000 | -- | |
| Flad Frichard | -- | -- | |
| Flad Frichard | -- | -- |
Source: Public Records
Mortgage History
| Date | Status | Borrower | Loan Amount |
|---|---|---|---|
| Open | Zervas Areti | $240,000 | |
| Closed | Flad Frichard | $240,000 |
Source: Public Records
Tax History Compared to Growth
Tax History
| Year | Tax Paid | Tax Assessment Tax Assessment Total Assessment is a certain percentage of the fair market value that is determined by local assessors to be the total taxable value of land and additions on the property. | Land | Improvement |
|---|---|---|---|---|
| 2025 | $6,211 | $501,700 | $224,200 | $277,500 |
| 2024 | $6,091 | $478,500 | $204,300 | $274,200 |
| 2023 | $5,890 | $434,700 | $189,900 | $244,800 |
| 2022 | $5,605 | $389,000 | $173,600 | $215,400 |
| 2021 | $5,354 | $354,600 | $157,300 | $197,300 |
| 2020 | $5,200 | $349,200 | $151,900 | $197,300 |
| 2019 | $5,107 | $332,900 | $151,900 | $181,000 |
| 2018 | $4,559 | $307,800 | $144,700 | $163,100 |
| 2017 | $4,266 | $294,400 | $137,400 | $157,000 |
| 2016 | $3,976 | $265,600 | $126,600 | $139,000 |
| 2015 | $3,910 | $258,400 | $119,400 | $139,000 |
| 2014 | $3,614 | $229,600 | $108,500 | $121,100 |
Source: Public Records
Map
Nearby Homes
- 115 Joanne Rd
- 15 Sparrow Rd
- 59 Summer Ave
- 52 Adams St
- 81 Summer St Unit 1
- 56 Station St
- 250 Morton St
- 12 Rose St Unit C
- 57 Whitney Ave
- 11 Springwood Ave
- 5-9 Morton Square
- 84 Pearl St
- 15-17 Morton Square
- 40 Horan Way
- Lot 4 West St
- 8 Margaret Rd
- 26 Faxon St Unit 2
- 103 Kim Terrace Unit A
- 386 Morton St
- 72 Rogers Dr