F
Seller's Agent in 2020
Feras Rachid
Opendoor Brokerage, LLC

Estimated Value: $128,670 - $174,000
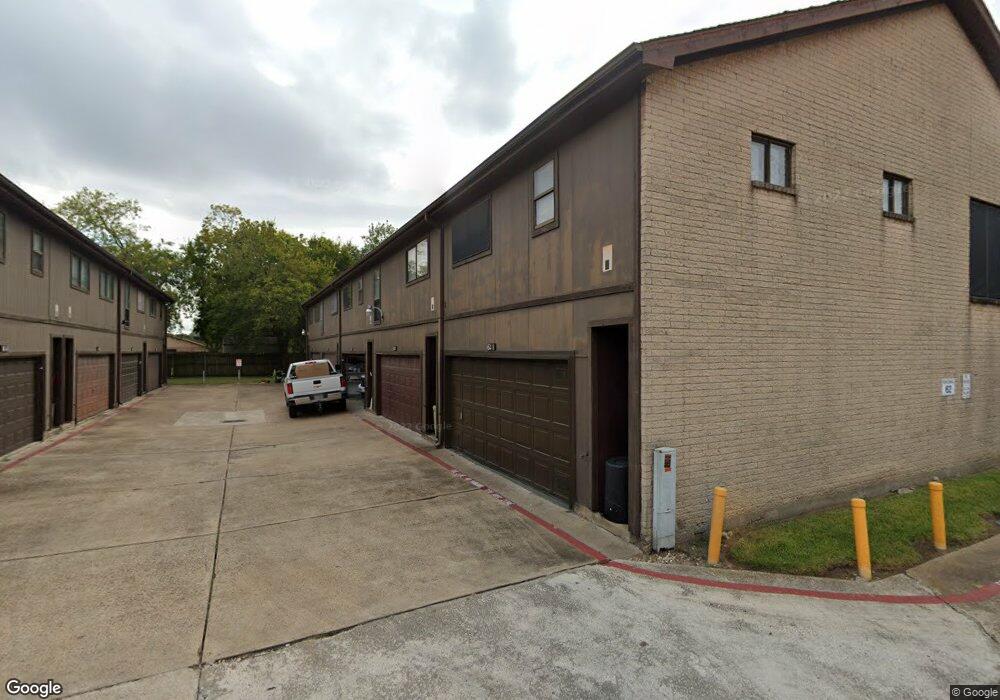
Stop worrying about lawn maintenance at this cozy two story townhouse. This townhome features an attached garage, wood burning fireplace, spacious ceilings, charming built in bookshelves and large windows. This home is vacant and cleaned regularly.
Last Agent to Sell the Property
Feras Rachid
Opendoor Brokerage, LLC License #0675842 Listed on: 03/16/2020

| Date | Buyer | Sale Price | Title Company |
|---|---|---|---|
| Alonso Sylvia | -- | Odtx | |
| Manes Korij | -- | Fidelity National Title | |
| Alcorn Bob B | -- | Fidelity National Title |
| Date | Status | Borrower | Loan Amount |
|---|---|---|---|
| Open | Alonso Sylvia | $108,007 | |
| Previous Owner | Manes Korij | $590,333 | |
| Previous Owner | Alcorn Bob B | $25,000 |
| Date | Event | Price | List to Sale | Price per Sq Ft | Prior Sale |
|---|---|---|---|---|---|
| 06/08/2025 06/08/25 | Off Market | -- | -- | -- | |
| 02/10/2025 02/10/25 | Off Market | -- | -- | -- | |
| 07/07/2020 07/07/20 | Sold | -- | -- | -- | |
| 06/07/2020 06/07/20 | Pending | -- | -- | -- | |
| 03/16/2020 03/16/20 | For Sale | $125,000 | 0.0% | $83 / Sq Ft | |
| 03/06/2020 03/06/20 | Sold | -- | -- | -- | View Prior Sale |
| 02/05/2020 02/05/20 | Pending | -- | -- | -- | |
| 08/28/2019 08/28/19 | For Sale | $125,000 | -- | $83 / Sq Ft |
| Year | Tax Paid | Tax Assessment Tax Assessment Total Assessment is a certain percentage of the fair market value that is determined by local assessors to be the total taxable value of land and additions on the property. | Land | Improvement |
|---|---|---|---|---|
| 2025 | $2,881 | $140,926 | $37,485 | $103,441 |
| 2024 | $2,881 | $134,293 | $37,485 | $96,808 |
| 2023 | $2,881 | $134,293 | $37,485 | $96,808 |
| 2022 | $2,805 | $120,649 | $24,990 | $95,659 |
| 2021 | $2,902 | $114,732 | $24,990 | $89,742 |
| 2020 | $2,700 | $104,653 | $24,990 | $79,663 |
| 2019 | $2,757 | $102,273 | $22,610 | $79,663 |
| 2018 | $1,539 | $97,806 | $16,184 | $81,622 |
| 2017 | $2,637 | $97,806 | $16,184 | $81,622 |
| 2016 | $2,516 | $93,336 | $16,184 | $77,152 |
| 2015 | $1,541 | $57,705 | $16,184 | $41,521 |
| 2014 | $1,541 | $57,705 | $16,184 | $41,521 |
F
Seller's Agent in 2020
Feras Rachid
Opendoor Brokerage, LLC
J
Seller's Agent in 2020
Jonathan Tyo
Loft Realty
Buyer's Agent in 2020
John Simms
Real Broker, LLC
(713) 384-4126
3 in this area
52 Total Sales
Buyer's Agent in 2020
Christian Wallace
LKV Realty ,LLC
(214) 405-8977
2 Total Sales
Source: Houston Association of REALTORS®
MLS Number: 49001795
APN: 1148930020001
Disclaimer: Certain information contained herein is derived from information provided by parties other than Homes.com. All information provided is deemed reliable, but is not guaranteed to be accurate and should be independently verified.
![]() Copyright 2026, Houston REALTORS® Information Service, Inc.
Copyright 2026, Houston REALTORS® Information Service, Inc.
The information provided is exclusively for consumers’ personal, non-commercial use, and may not be used for any purpose other than to identify prospective properties consumers may be interested in purchasing.
Information is deemed reliable but not guaranteed.
Ask me questions while you tour the home.