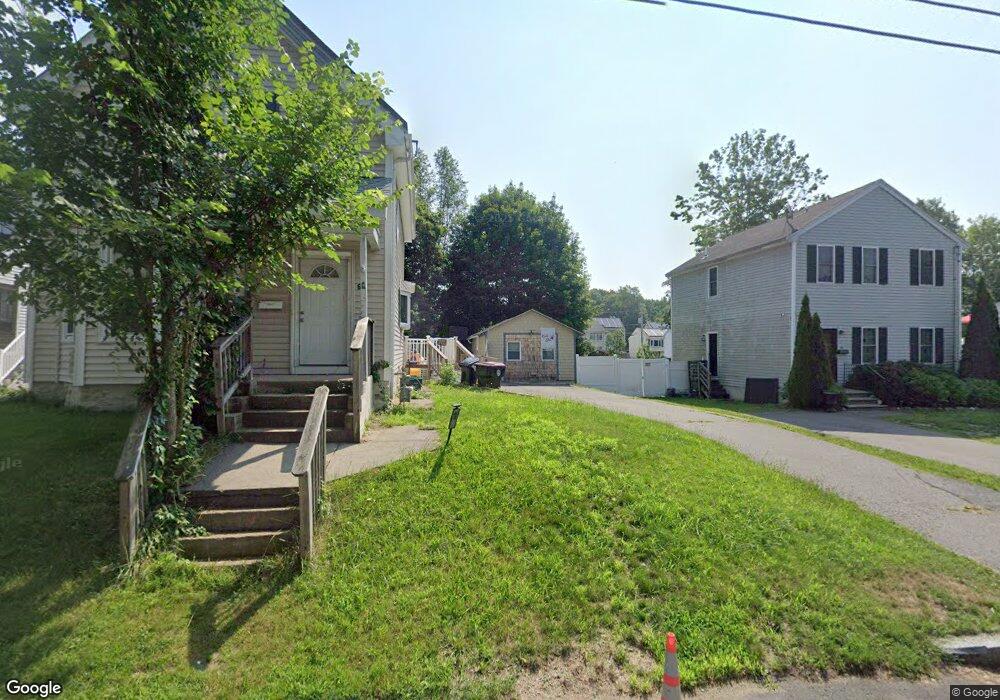
62 Galen St Brockton, MA 02302
Estimated Value: $452,000 - $511,000
3
Beds
2
Baths
1,348
Sq Ft
$360/Sq Ft
Est. Value
About This Home
This home is located at 62 Galen St, Brockton, MA 02302 and is currently estimated at $485,658, approximately $360 per square foot. 62 Galen St is a home located in Plymouth County with nearby schools including Brookfield Elementary School, Downey Elementary School, and Mary E. Baker Elementary School.
Ownership History
Date
Name
Owned For
Owner Type
Purchase Details
Closed on
Jul 8, 2015
Sold by
Galen 62 Rt
Bought by
Agosto Jean C and Agosto Jeyris
Current Estimated Value
Home Financials for this Owner
Home Financials are based on the most recent Mortgage that was taken out on this home.
Original Mortgage
$199,900
Outstanding Balance
$155,925
Interest Rate
3.87%
Mortgage Type
New Conventional
Estimated Equity
$329,733
Purchase Details
Closed on
Jan 23, 2015
Sold by
Marenco Paul and Ramirez Paula
Bought by
Dealvarenga Carlos O and Lopes Renisa A
Home Financials for this Owner
Home Financials are based on the most recent Mortgage that was taken out on this home.
Original Mortgage
$274,928
Interest Rate
3.75%
Mortgage Type
FHA
Purchase Details
Closed on
Jun 11, 2013
Sold by
M & J Holdings Llc
Bought by
Marenco Paul and Ramirez Paula
Home Financials for this Owner
Home Financials are based on the most recent Mortgage that was taken out on this home.
Original Mortgage
$255,192
Interest Rate
3.37%
Mortgage Type
FHA
Purchase Details
Closed on
Dec 27, 2012
Sold by
Galen 62 Rt
Bought by
M & J Holdings Llc
Home Financials for this Owner
Home Financials are based on the most recent Mortgage that was taken out on this home.
Original Mortgage
$125,000
Interest Rate
3.38%
Mortgage Type
New Conventional
Purchase Details
Closed on
Jan 20, 2012
Sold by
Fritz Steven R
Bought by
62 Galen Street Rt
Home Financials for this Owner
Home Financials are based on the most recent Mortgage that was taken out on this home.
Original Mortgage
$155,944
Interest Rate
3.87%
Mortgage Type
FHA
Purchase Details
Closed on
Feb 28, 2011
Sold by
Fnma
Bought by
62 Galen Street Rt
Home Financials for this Owner
Home Financials are based on the most recent Mortgage that was taken out on this home.
Original Mortgage
$107,000
Interest Rate
4.75%
Mortgage Type
Purchase Money Mortgage
Purchase Details
Closed on
Aug 25, 2010
Sold by
Dearing Donald
Bought by
Federal National Mortgage Association
Create a Home Valuation Report for This Property
The Home Valuation Report is an in-depth analysis detailing your home's value as well as a comparison with similar homes in the area
Home Values in the Area
Average Home Value in this Area
Purchase History
| Date | Buyer | Sale Price | Title Company |
|---|---|---|---|
| Agosto Jean C | $199,900 | -- | |
| Dealvarenga Carlos O | $280,000 | -- | |
| Marenco Paul | $259,900 | -- | |
| Marenco Paul | $259,900 | -- | |
| M & J Holdings Llc | $35,000 | -- | |
| 62 Galen Street Rt | -- | -- | |
| Fritz Steven R | $160,000 | -- | |
| 62 Galen Street Rt | $89,900 | -- | |
| Federal National Mortgage Association | $227,596 | -- |
Source: Public Records
Mortgage History
| Date | Status | Borrower | Loan Amount |
|---|---|---|---|
| Open | Agosto Jean C | $199,900 | |
| Previous Owner | Dealvarenga Carlos O | $274,928 | |
| Previous Owner | Marenco Paul | $255,192 | |
| Previous Owner | M & J Holdings Llc | $125,000 | |
| Previous Owner | Fritz Steven R | $155,944 | |
| Previous Owner | 62 Galen Street Rt | $107,000 |
Source: Public Records
Tax History Compared to Growth
Tax History
| Year | Tax Paid | Tax Assessment Tax Assessment Total Assessment is a certain percentage of the fair market value that is determined by local assessors to be the total taxable value of land and additions on the property. | Land | Improvement |
|---|---|---|---|---|
| 2025 | $4,885 | $403,400 | $140,100 | $263,300 |
| 2024 | $4,739 | $394,300 | $140,100 | $254,200 |
| 2023 | $4,473 | $344,600 | $104,200 | $240,400 |
| 2022 | $4,184 | $299,500 | $94,700 | $204,800 |
| 2021 | $3,757 | $259,100 | $78,600 | $180,500 |
| 2020 | $3,474 | $229,300 | $73,700 | $155,600 |
| 2019 | $3,385 | $217,800 | $71,900 | $145,900 |
| 2018 | $3,085 | $192,100 | $71,900 | $120,200 |
| 2017 | $2,924 | $181,600 | $71,900 | $109,700 |
| 2016 | $2,916 | $168,000 | $69,700 | $98,300 |
| 2015 | $2,459 | $135,500 | $69,700 | $65,800 |
| 2014 | $2,560 | $141,200 | $69,700 | $71,500 |
Source: Public Records
Map
Nearby Homes