Estimated Value: $565,000 - $636,000
4
Beds
3
Baths
1,576
Sq Ft
$384/Sq Ft
Est. Value
About This Home
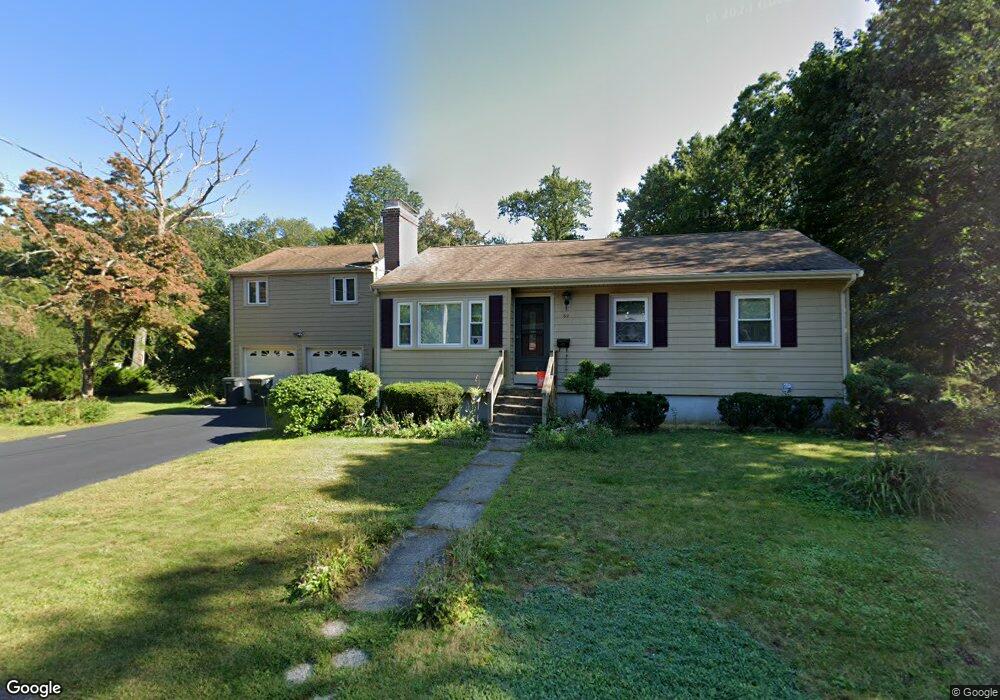
This home is located at 62 Granite St, Avon, MA 02322 and is currently estimated at $605,972, approximately $384 per square foot. 62 Granite St is a home located in Norfolk County with nearby schools including Ralph D. Butler Elementary School, Avon Middle/High School, and Boston Higashi School.
Ownership History
Date
Name
Owned For
Owner Type
Purchase Details
Closed on
May 19, 2016
Sold by
Wilkerson Cheryl M
Bought by
Wilkerson Cheryl M and Cooks Rochelle T
Current Estimated Value
Purchase Details
Closed on
Sep 23, 1988
Sold by
Mcfarlane Lloyd A
Bought by
Wilkerson Cheryl M
Home Financials for this Owner
Home Financials are based on the most recent Mortgage that was taken out on this home.
Original Mortgage
$123,750
Interest Rate
10.51%
Mortgage Type
Purchase Money Mortgage
Create a Home Valuation Report for This Property
The Home Valuation Report is an in-depth analysis detailing your home's value as well as a comparison with similar homes in the area
Home Values in the Area
Average Home Value in this Area
Purchase History
| Date | Buyer | Sale Price | Title Company |
|---|---|---|---|
| Wilkerson Cheryl M | -- | -- | |
| Wilkerson Cheryl M | $165,000 | -- |
Source: Public Records
Mortgage History
| Date | Status | Borrower | Loan Amount |
|---|---|---|---|
| Previous Owner | Wilkerson Cheryl M | $112,000 | |
| Previous Owner | Wilkerson Cheryl M | $123,750 |
Source: Public Records
Tax History
| Year | Tax Paid | Tax Assessment Tax Assessment Total Assessment is a certain percentage of the fair market value that is determined by local assessors to be the total taxable value of land and additions on the property. | Land | Improvement |
|---|---|---|---|---|
| 2025 | $73 | $545,200 | $226,800 | $318,400 |
| 2024 | $6,566 | $468,000 | $205,500 | $262,500 |
| 2023 | $6,374 | $468,000 | $205,500 | $262,500 |
| 2022 | $6,503 | $411,300 | $171,400 | $239,900 |
| 2021 | $5,920 | $352,800 | $155,500 | $197,300 |
| 2020 | $6,379 | $360,400 | $152,500 | $207,900 |
| 2019 | $5,642 | $313,600 | $145,600 | $168,000 |
| 2018 | $5,738 | $309,300 | $145,600 | $163,700 |
| 2017 | $5,023 | $290,700 | $145,600 | $145,100 |
| 2016 | $4,794 | $280,200 | $138,600 | $141,600 |
| 2015 | $4,381 | $267,600 | $132,200 | $135,400 |
Source: Public Records
Map
Nearby Homes
Your Personal Tour Guide
Ask me questions while you tour the home.