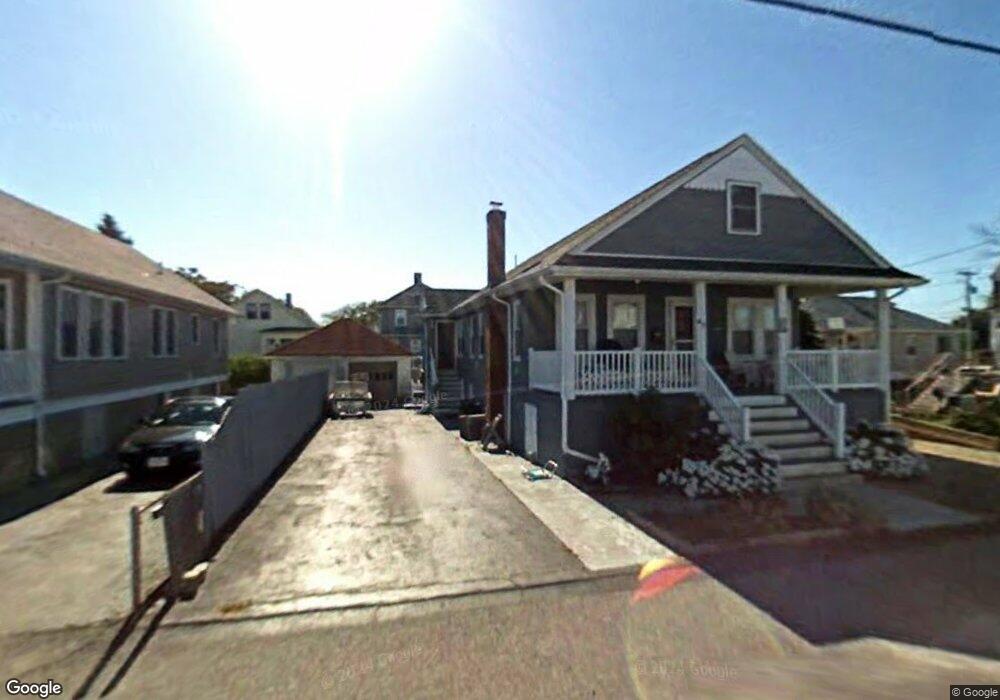
62 H St Hull, MA 02045
The Alphabets NeighborhoodEstimated Value: $709,000 - $764,000
4
Beds
2
Baths
1,425
Sq Ft
$518/Sq Ft
Est. Value
About This Home
This home is located at 62 H St, Hull, MA 02045 and is currently estimated at $738,256, approximately $518 per square foot. 62 H St is a home located in Plymouth County with nearby schools including Lillian M. Jacobs Elementary School, Memorial Middle School, and Hull High School.
Ownership History
Date
Name
Owned For
Owner Type
Purchase Details
Closed on
May 13, 2011
Sold by
Fitzgerald Nancy A
Bought by
Harmer Donald W and Harmer Emily L
Current Estimated Value
Home Financials for this Owner
Home Financials are based on the most recent Mortgage that was taken out on this home.
Original Mortgage
$252,000
Outstanding Balance
$175,128
Interest Rate
4.88%
Mortgage Type
Purchase Money Mortgage
Estimated Equity
$563,128
Purchase Details
Closed on
Jun 20, 2008
Sold by
Fitzgerald Robert C
Bought by
Fitzgerald Nancy A
Purchase Details
Closed on
Sep 17, 2003
Sold by
Barrows Edward L and Barrows Helene A
Bought by
Fitzgerald Robert C and Fitzgerald Nancy A
Purchase Details
Closed on
Dec 7, 1994
Sold by
Barrows Michael J
Bought by
Barrows Edward L and Barrows Helene A
Purchase Details
Closed on
Jul 14, 1992
Sold by
Ryan Walter J
Bought by
Federal National Mortgage Association
Create a Home Valuation Report for This Property
The Home Valuation Report is an in-depth analysis detailing your home's value as well as a comparison with similar homes in the area
Home Values in the Area
Average Home Value in this Area
Purchase History
| Date | Buyer | Sale Price | Title Company |
|---|---|---|---|
| Harmer Donald W | $282,500 | -- | |
| Fitzgerald Nancy A | -- | -- | |
| Fitzgerald Robert C | $360,000 | -- | |
| Barrows Edward L | $83,000 | -- | |
| Barrows Edward L | $83,000 | -- | |
| Federal National Mortgage Association | $98,100 | -- |
Source: Public Records
Mortgage History
| Date | Status | Borrower | Loan Amount |
|---|---|---|---|
| Open | Harmer Donald W | $252,000 | |
| Previous Owner | Federal National Mortgage Association | $258,100 | |
| Previous Owner | Federal National Mortgage Association | $37,000 |
Source: Public Records
Tax History
| Year | Tax Paid | Tax Assessment Tax Assessment Total Assessment is a certain percentage of the fair market value that is determined by local assessors to be the total taxable value of land and additions on the property. | Land | Improvement |
|---|---|---|---|---|
| 2025 | $6,649 | $593,700 | $328,200 | $265,500 |
| 2024 | $6,433 | $552,200 | $303,000 | $249,200 |
| 2023 | $5,939 | $488,000 | $252,500 | $235,500 |
| 2022 | $5,661 | $451,400 | $239,800 | $211,600 |
| 2021 | $5,607 | $442,200 | $239,800 | $202,400 |
| 2020 | $5,231 | $408,000 | $239,800 | $168,200 |
| 2019 | $4,920 | $377,000 | $214,600 | $162,400 |
| 2018 | $4,749 | $353,900 | $214,600 | $139,300 |
| 2017 | $4,728 | $344,600 | $214,600 | $130,000 |
| 2016 | $4,645 | $344,600 | $214,600 | $130,000 |
| 2015 | $4,451 | $319,300 | $189,300 | $130,000 |
| 2014 | $4,364 | $314,600 | $189,300 | $125,300 |
Source: Public Records
Map
Nearby Homes
Your Personal Tour Guide
Ask me questions while you tour the home.