62 Hidden Fields Rd Hiawassee, GA 30546
Estimated Value: $1,061,000 - $1,477,000
Studio
1
Bath
3,641
Sq Ft
$336/Sq Ft
Est. Value
About This Home
This home is located at 62 Hidden Fields Rd, Hiawassee, GA 30546 and is currently estimated at $1,222,974, approximately $335 per square foot. 62 Hidden Fields Rd is a home located in Towns County with nearby schools including Towns County Elementary School, Towns County Middle School, and Towns County High School.
Ownership History
Date
Name
Owned For
Owner Type
Purchase Details
Closed on
Jun 8, 2021
Sold by
Carter Ralph T
Bought by
Carter Ralph Thomas and Carter Teresa Ann
Current Estimated Value
Purchase Details
Closed on
May 1, 2013
Sold by
Ralph G and Ralph Sandra M
Bought by
Carter Ralph T and Carter Teresa A
Purchase Details
Closed on
Nov 17, 2011
Sold by
Turner Todd
Bought by
Turner Ralph G and Turner Sandra M
Purchase Details
Closed on
Sep 1, 2005
Sold by
Simon Carol
Bought by
Turner Todd and Turner Ralph
Home Financials for this Owner
Home Financials are based on the most recent Mortgage that was taken out on this home.
Original Mortgage
$241,395
Interest Rate
5.77%
Mortgage Type
New Conventional
Purchase Details
Closed on
Aug 13, 2002
Sold by
4 Evers Inc
Bought by
Simon Carol and Simon Bearse
Create a Home Valuation Report for This Property
The Home Valuation Report is an in-depth analysis detailing your home's value as well as a comparison with similar homes in the area
Home Values in the Area
Average Home Value in this Area
Purchase History
| Date | Buyer | Sale Price | Title Company |
|---|---|---|---|
| Carter Ralph Thomas | -- | -- | |
| Carter Ralph T | $300,000 | -- | |
| Turner Ralph G | -- | -- | |
| Turner Todd | $232,500 | -- | |
| Turner Todd | $232,500 | -- | |
| Simon Carol | $275,000 | -- |
Source: Public Records
Mortgage History
| Date | Status | Borrower | Loan Amount |
|---|---|---|---|
| Previous Owner | Turner Todd | $241,395 |
Source: Public Records
Tax History
| Year | Tax Paid | Tax Assessment Tax Assessment Total Assessment is a certain percentage of the fair market value that is determined by local assessors to be the total taxable value of land and additions on the property. | Land | Improvement |
|---|---|---|---|---|
| 2024 | $3,852 | $358,716 | $140,000 | $218,716 |
| 2023 | $3,824 | $326,314 | $130,000 | $196,314 |
| 2022 | $3,681 | $314,135 | $130,000 | $184,135 |
| 2021 | $3,206 | $265,866 | $120,000 | $145,866 |
| 2020 | $3,102 | $242,061 | $110,000 | $132,061 |
| 2019 | $3,070 | $235,692 | $110,000 | $125,692 |
| 2018 | $3,100 | $232,189 | $110,000 | $122,189 |
| 2017 | $2,966 | $214,476 | $90,000 | $124,476 |
| 2016 | $2,967 | $214,476 | $90,000 | $124,476 |
| 2015 | $3,005 | $214,476 | $90,000 | $124,476 |
| 2014 | $1,401 | $99,177 | $90,000 | $9,177 |
| 2013 | -- | $90,000 | $90,000 | $0 |
Source: Public Records
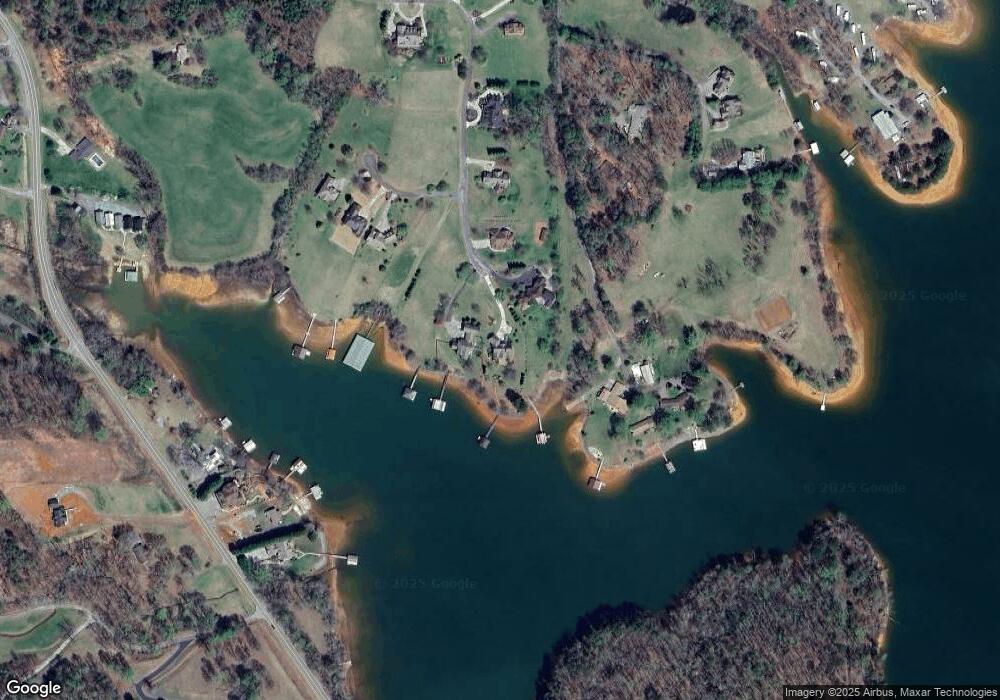
Map
Nearby Homes
- 41 Hidden Fields Rd
- 288 Sunnyside Rd
- 1586 Us Hwy 76
- #2A & 2B Tranquil Pointe
- Lot 19 The Highlands
- Lot 3A/B Tranquil Pointe Ln
- 2038 Highway 76
- 2038 U S 76
- 1481 Phillips Cove Dr
- 1507 Cedar View Ln
- 223 Red Bud Ln
- 1529 Cedar View Ct
- 1526 Cedar View Ln
- 1444 Kelley Way
- 1370 Heathers Cove Cir
- 2000 Russell Manor Rd
- 1803 Chatuge Hills Rd
- 2145 Ridgecrest Cir
- 0 Frog Pond Rd Unit 7731873
- 0 Frog Pond Rd Unit 10707426
- 61 Hidden Fields Rd Unit 18
- 61 Hidden Fields Rd
- 63 Hidden Fields Rd
- 52 Hidden Fields Rd
- 59 Hidden Fields Rd
- 65 Hidden Fields Rd Unit 20
- 65 Hidden Fields Rd
- 41 Hidden Fields Ln
- 41 Hidden Fields Estate
- 67 Hidden Fields Rd
- 55 Hidden Fields Rd
- 57 Hidden Fields Rd
- 60 Hidden Fields Rd
- 51 Hidden Fields Rd
- 51 Hidden Fields Rd Unit 13
- 879 Waldroup Rd
- 7 Tara Ln
- Lot #43 Hidden Fields Rd
- LOT 14 Hidden Fields Rd
- LT 16 Hidden Fields Rd
Your Personal Tour Guide
Ask me questions while you tour the home.