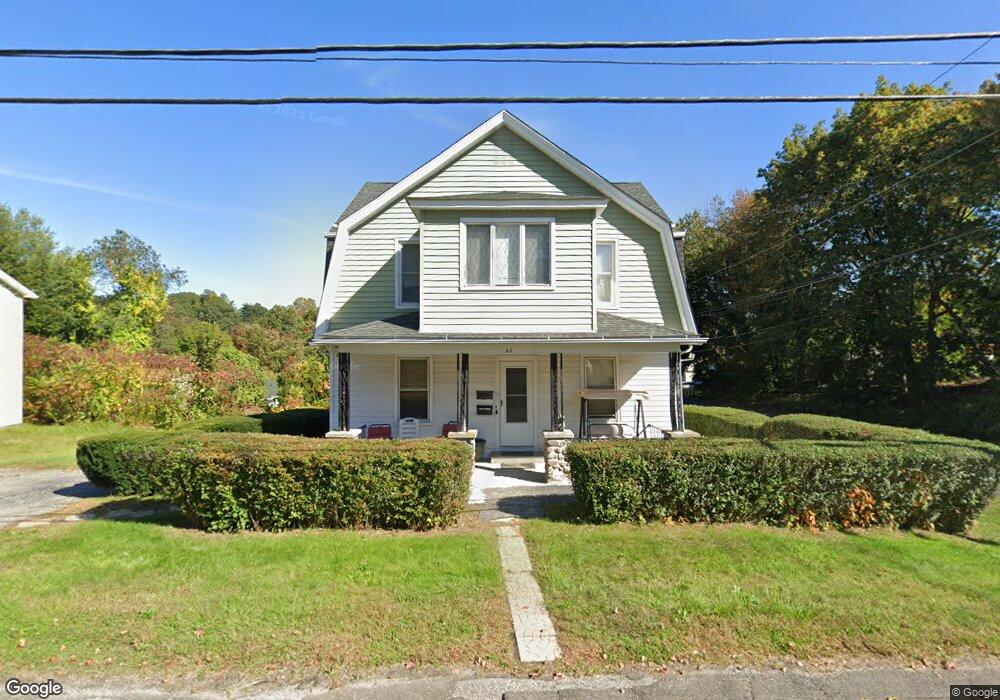
62 Hillcrest Ave Waterbury, CT 06705
Estimated Value: $294,129 - $397,000
2
Beds
1
Bath
1,820
Sq Ft
$195/Sq Ft
Est. Value
About This Home
This home is located at 62 Hillcrest Ave, Waterbury, CT 06705 and is currently estimated at $355,782, approximately $195 per square foot. 62 Hillcrest Ave is a home located in New Haven County with nearby schools including Wendell L. Cross Elementary School, Michael F. Wallace Middle School, and Crosby High School.
Ownership History
Date
Name
Owned For
Owner Type
Purchase Details
Closed on
Feb 1, 2010
Sold by
Dearing Elanne A and Dearing Robert W
Bought by
Piorkowski Mark and Piorkowski Mary
Current Estimated Value
Purchase Details
Closed on
Jan 11, 2005
Sold by
Motcat Inc
Bought by
Cuevas Ingrid R
Home Financials for this Owner
Home Financials are based on the most recent Mortgage that was taken out on this home.
Original Mortgage
$163,210
Interest Rate
5.75%
Mortgage Type
Purchase Money Mortgage
Purchase Details
Closed on
Aug 12, 2003
Sold by
Dunn Margherita C
Bought by
Motcat Inc
Home Financials for this Owner
Home Financials are based on the most recent Mortgage that was taken out on this home.
Original Mortgage
$137,127
Interest Rate
5.28%
Mortgage Type
Purchase Money Mortgage
Create a Home Valuation Report for This Property
The Home Valuation Report is an in-depth analysis detailing your home's value as well as a comparison with similar homes in the area
Home Values in the Area
Average Home Value in this Area
Purchase History
| Date | Buyer | Sale Price | Title Company |
|---|---|---|---|
| Piorkowski Mark | $190,000 | -- | |
| Cuevas Ingrid R | $171,800 | -- | |
| Motcat Inc | $129,900 | -- |
Source: Public Records
Mortgage History
| Date | Status | Borrower | Loan Amount |
|---|---|---|---|
| Previous Owner | Motcat Inc | $163,210 | |
| Previous Owner | Motcat Inc | $137,127 | |
| Previous Owner | Motcat Inc | $26,500 |
Source: Public Records
Tax History Compared to Growth
Tax History
| Year | Tax Paid | Tax Assessment Tax Assessment Total Assessment is a certain percentage of the fair market value that is determined by local assessors to be the total taxable value of land and additions on the property. | Land | Improvement |
|---|---|---|---|---|
| 2025 | $5,403 | $120,120 | $20,580 | $99,540 |
| 2024 | $5,939 | $120,120 | $20,580 | $99,540 |
| 2023 | $6,509 | $120,120 | $20,580 | $99,540 |
| 2022 | $4,003 | $66,490 | $20,580 | $45,910 |
| 2021 | $4,003 | $66,490 | $20,580 | $45,910 |
| 2020 | $4,003 | $66,490 | $20,580 | $45,910 |
| 2019 | $4,003 | $66,490 | $20,580 | $45,910 |
| 2018 | $4,003 | $66,490 | $20,580 | $45,910 |
| 2017 | $4,701 | $78,080 | $20,580 | $57,500 |
| 2016 | $4,701 | $78,080 | $20,580 | $57,500 |
| 2015 | $4,546 | $78,080 | $20,580 | $57,500 |
| 2014 | $4,546 | $78,080 | $20,580 | $57,500 |
Source: Public Records
Map
Nearby Homes
- 280 Ridgefield Ave
- 2916 E Main St
- 207 Ridgefield Ave
- 110 Midland Rd
- 152 Woodbine St
- 124 Woodbine St
- 106 Greenleaf Ave
- 100 Ridgefield Ave
- 24 Alton St
- 135 Norris St
- 0 Frost Rd Unit 24084658
- 975 Meriden Rd Unit 20
- 975 Meriden Rd Unit 3
- 129 Fairlawn Ave
- 17 Capitol Ave
- 260 Scott Rd Unit 1
- 531 Meriden Rd Unit 2
- 302 Lakeview Ave
- 268 Scott Rd Unit 3
- 27 Amber Place
- 63 Hillcrest Ave
- 16 Craigie Ave
- 70 Hillcrest Ave
- 76 Hillcrest Ave
- 73 Hillcrest Ave
- 48 Hillcrest Ave
- 44 Craigie Ave
- 49 Hillcrest Ave
- 82 Hillcrest Ave
- 9 Craigie Ave
- 5 Craigie Ave
- 86 Hillcrest Ave
- 121 Meriline Ave
- 127 Meriline Ave
- Lot 21 Hillcrest Ave
- 83 Hillcrest Ave
- 36 Hillcrest Ave
- 135 Meriline Ave
- 52 Craigie Ave
- 90 Hillcrest Ave