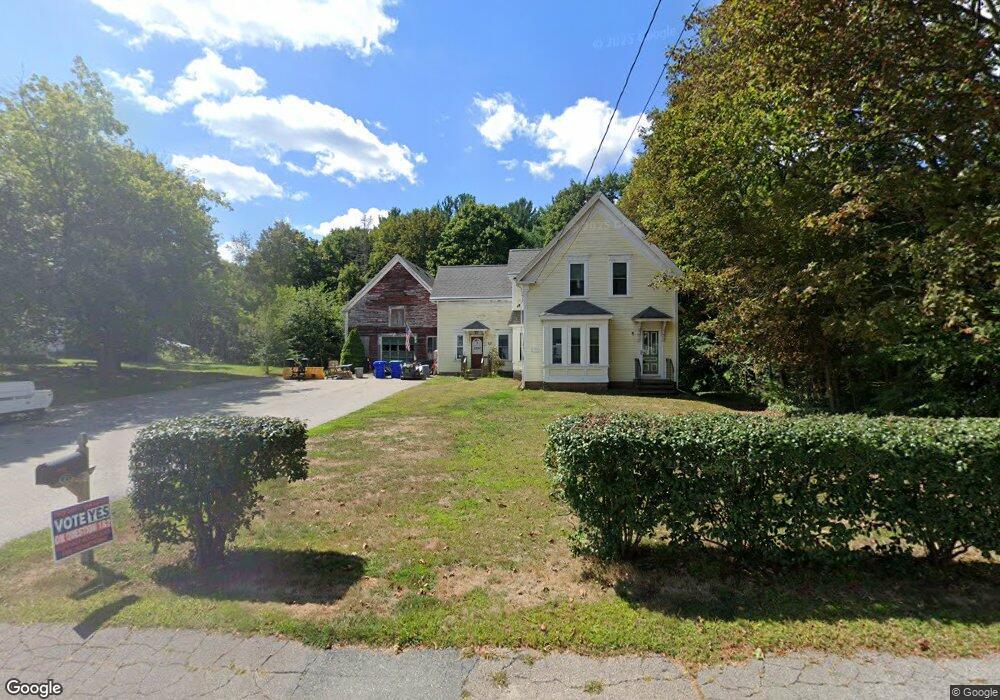
62 Hingham St Rockland, MA 02370
Estimated Value: $608,000 - $690,000
2
Beds
2
Baths
1,715
Sq Ft
$385/Sq Ft
Est. Value
About This Home
This home is located at 62 Hingham St, Rockland, MA 02370 and is currently estimated at $660,846, approximately $385 per square foot. 62 Hingham St is a home located in Plymouth County with nearby schools including Rockland Senior High School, Calvary Chapel Academy, and Holy Family Elementary School.
Ownership History
Date
Name
Owned For
Owner Type
Purchase Details
Closed on
Jan 24, 1997
Sold by
Gregory Eryn K
Bought by
Hamilton James E
Current Estimated Value
Purchase Details
Closed on
Feb 27, 1995
Sold by
Leadbetter Dorothy F
Bought by
Gregory Eryn K
Create a Home Valuation Report for This Property
The Home Valuation Report is an in-depth analysis detailing your home's value as well as a comparison with similar homes in the area
Home Values in the Area
Average Home Value in this Area
Purchase History
| Date | Buyer | Sale Price | Title Company |
|---|---|---|---|
| Hamilton James E | $140,000 | -- | |
| Gregory Eryn K | $130,000 | -- |
Source: Public Records
Mortgage History
| Date | Status | Borrower | Loan Amount |
|---|---|---|---|
| Open | Gregory Eryn K | $115,000 | |
| Closed | Gregory Eryn K | $104,500 | |
| Closed | Gregory Eryn K | $105,000 |
Source: Public Records
Tax History
| Year | Tax Paid | Tax Assessment Tax Assessment Total Assessment is a certain percentage of the fair market value that is determined by local assessors to be the total taxable value of land and additions on the property. | Land | Improvement |
|---|---|---|---|---|
| 2025 | $7,724 | $565,000 | $253,800 | $311,200 |
| 2024 | $7,498 | $533,300 | $239,400 | $293,900 |
| 2023 | $7,292 | $479,100 | $209,100 | $270,000 |
| 2022 | $6,986 | $417,100 | $181,900 | $235,200 |
| 2021 | $6,568 | $380,100 | $165,400 | $214,700 |
| 2020 | $6,337 | $362,100 | $157,500 | $204,600 |
| 2019 | $6,186 | $345,200 | $149,900 | $195,300 |
| 2018 | $5,858 | $321,500 | $149,900 | $171,600 |
| 2017 | $5,659 | $306,200 | $149,900 | $156,300 |
| 2016 | $5,447 | $294,600 | $144,100 | $150,500 |
| 2015 | $5,170 | $271,700 | $134,800 | $136,900 |
| 2014 | $4,889 | $266,600 | $132,300 | $134,300 |
Source: Public Records
Map
Nearby Homes
- 206-208 Hinghm St
- 15 Bradford St
- 26 Hobart Ln Unit 26,C
- 1 Von Rhor Dr Unit 1
- 48 Bigelow Ave
- 63 Webster St
- 117 Liberty St
- 186 Vernon St
- 19 Dyer St Unit 19
- 737-739 Union St
- 108 Deerfield Ln
- 9 Old Market St
- 7 Boxberry Ln Unit 7
- 3 Leslie Ct
- 18 Boxberry Ln Unit 18
- 50 Linden Park
- 1 Canterbury Ln
- 9 Juniper Cir
- 738 Whiting St
- 6 Chestnut Cir
- 46 Hingham St
- 70 Hingham St
- 70 Hingham St Unit 2
- 70 Hingham St Unit 1
- 78 Hingham St
- 67 Hingham St
- 42 Hingham St
- 55 Hingham St
- 47 Hingham St
- 92 Hingham St
- 32 Hingham St
- 1 White Rd
- 53 Hingham St
- 22 Hingham Gardens
- 39 Hingham St
- 29 Hingham St
- 29 Hingham St Unit 2
- 10 Hingham St
- 23 Hingham St
- 104 Hingham St
Your Personal Tour Guide
Ask me questions while you tour the home.