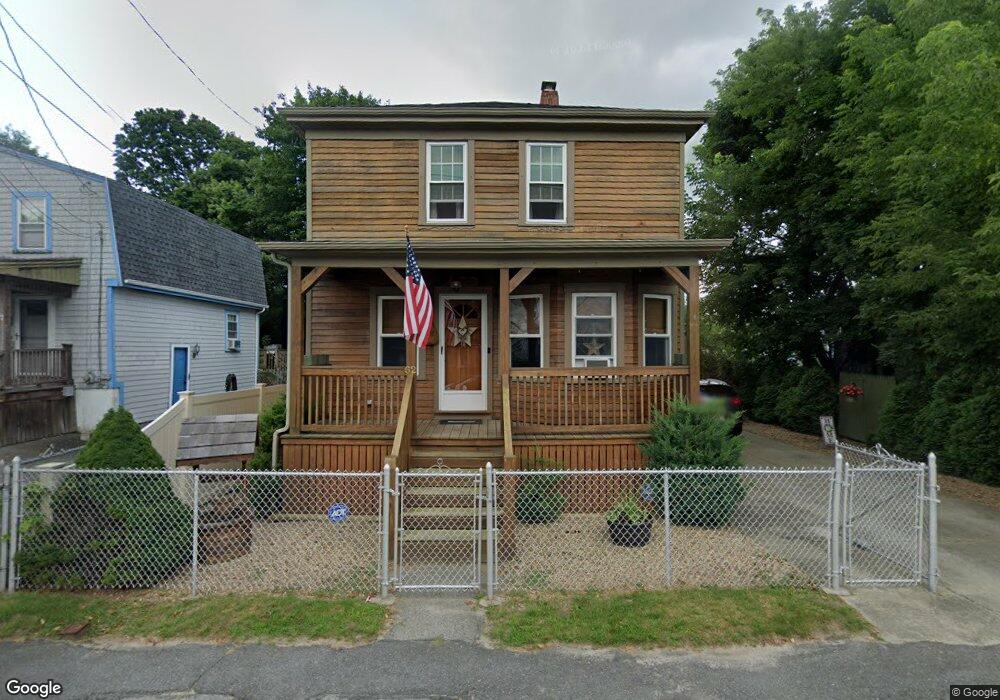
62 Jean St Acushnet, MA 02743
Estimated Value: $407,834 - $474,000
3
Beds
2
Baths
1,474
Sq Ft
$299/Sq Ft
Est. Value
About This Home
This home is located at 62 Jean St, Acushnet, MA 02743 and is currently estimated at $441,459, approximately $299 per square foot. 62 Jean St is a home located in Bristol County with nearby schools including Acushnet Elementary School, Albert F Ford Middle School, and Alma Del Mar Charter School.
Ownership History
Date
Name
Owned For
Owner Type
Purchase Details
Closed on
Sep 2, 1988
Sold by
Lepore Donald W
Bought by
Brizida David J
Current Estimated Value
Home Financials for this Owner
Home Financials are based on the most recent Mortgage that was taken out on this home.
Original Mortgage
$90,000
Interest Rate
10.38%
Mortgage Type
Purchase Money Mortgage
Purchase Details
Closed on
Mar 21, 1988
Sold by
Boutin Kerran
Bought by
Lepore Donald W
Create a Home Valuation Report for This Property
The Home Valuation Report is an in-depth analysis detailing your home's value as well as a comparison with similar homes in the area
Home Values in the Area
Average Home Value in this Area
Purchase History
| Date | Buyer | Sale Price | Title Company |
|---|---|---|---|
| Brizida David J | $106,000 | -- | |
| Lepore Donald W | $78,000 | -- |
Source: Public Records
Mortgage History
| Date | Status | Borrower | Loan Amount |
|---|---|---|---|
| Open | Lepore Donald W | $63,850 | |
| Open | Lepore Donald W | $107,000 | |
| Closed | Lepore Donald W | $80,000 | |
| Closed | Lepore Donald W | $90,000 |
Source: Public Records
Tax History
| Year | Tax Paid | Tax Assessment Tax Assessment Total Assessment is a certain percentage of the fair market value that is determined by local assessors to be the total taxable value of land and additions on the property. | Land | Improvement |
|---|---|---|---|---|
| 2025 | $38 | $351,200 | $87,600 | $263,600 |
| 2024 | $3,512 | $307,800 | $83,500 | $224,300 |
| 2023 | $3,463 | $288,600 | $75,400 | $213,200 |
| 2022 | $3,210 | $241,900 | $71,300 | $170,600 |
| 2021 | $3,128 | $226,200 | $71,300 | $154,900 |
| 2020 | $3,153 | $226,200 | $71,300 | $154,900 |
| 2019 | $2,972 | $209,600 | $63,200 | $146,400 |
| 2018 | $2,859 | $198,300 | $63,200 | $135,100 |
| 2017 | $2,748 | $190,300 | $63,200 | $127,100 |
| 2016 | $2,560 | $176,200 | $63,200 | $113,000 |
| 2015 | $2,516 | $176,200 | $63,200 | $113,000 |
Source: Public Records
Map
Nearby Homes
- 12 Hayes St Unit 1
- 14 Hayes St Unit 1
- 91 S Main St
- 81 Sylvia St
- 53 Howard Ave
- 759 Belleville Ave
- 0 Hathaway Rd Unit 73469544
- 1940-1942 Acushnet Ave
- 99 Hatch St
- 14 Caswell St
- 4 Sam St
- 5 William St
- 65 Armsby St
- 41 Chershire Ave
- 303 Cummington St
- 25 Pershing Ave
- 1840 1846 Acushnet Ave
- 121 Hope St
- 12 Pontiac St
- 9 Monmouth St