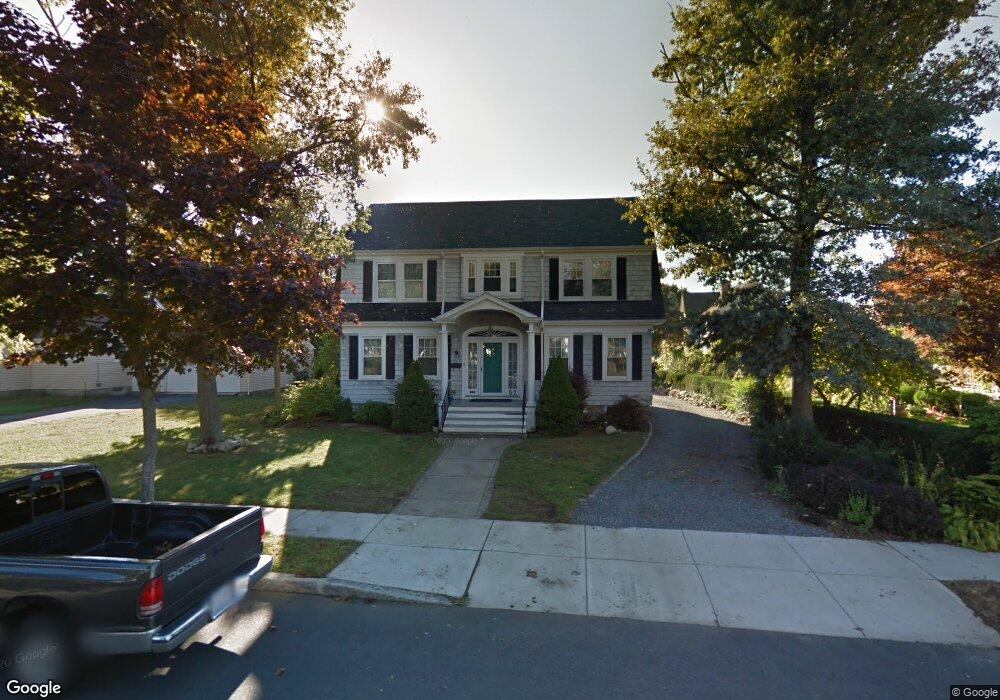
62 Laurel St Fairhaven, MA 02719
Estimated Value: $742,000 - $769,000
4
Beds
2
Baths
2,324
Sq Ft
$325/Sq Ft
Est. Value
About This Home
This home is located at 62 Laurel St, Fairhaven, MA 02719 and is currently estimated at $754,758, approximately $324 per square foot. 62 Laurel St is a home located in Bristol County with nearby schools including Fairhaven High School, City On A Hill Charter Public School New Bedford, and St. Joseph School.
Ownership History
Date
Name
Owned For
Owner Type
Purchase Details
Closed on
Oct 26, 2007
Sold by
Butero Marylou M and Butero Thomas J
Bought by
Dobson Ian and Bishop Jennifer
Current Estimated Value
Home Financials for this Owner
Home Financials are based on the most recent Mortgage that was taken out on this home.
Original Mortgage
$260,000
Interest Rate
6.39%
Mortgage Type
Purchase Money Mortgage
Purchase Details
Closed on
Sep 26, 1997
Sold by
Lumbard Alden H and Lumbard Priscilla M
Bought by
Butero Thomas J and Butero Marylou M
Create a Home Valuation Report for This Property
The Home Valuation Report is an in-depth analysis detailing your home's value as well as a comparison with similar homes in the area
Home Values in the Area
Average Home Value in this Area
Purchase History
| Date | Buyer | Sale Price | Title Company |
|---|---|---|---|
| Dobson Ian | $520,000 | -- | |
| Butero Thomas J | $200,000 | -- |
Source: Public Records
Mortgage History
| Date | Status | Borrower | Loan Amount |
|---|---|---|---|
| Open | Butero Thomas J | $260,000 | |
| Closed | Butero Thomas J | $260,000 | |
| Previous Owner | Butero Thomas J | $148,042 |
Source: Public Records
Tax History
| Year | Tax Paid | Tax Assessment Tax Assessment Total Assessment is a certain percentage of the fair market value that is determined by local assessors to be the total taxable value of land and additions on the property. | Land | Improvement |
|---|---|---|---|---|
| 2025 | $59 | $629,200 | $243,300 | $385,900 |
| 2024 | $5,726 | $620,400 | $243,300 | $377,100 |
| 2023 | $5,523 | $555,100 | $209,900 | $345,200 |
| 2022 | $5,213 | $510,100 | $191,200 | $318,900 |
| 2021 | $4,177 | $456,200 | $173,800 | $282,400 |
| 2020 | $5,046 | $456,200 | $173,800 | $282,400 |
| 2019 | $4,815 | $412,600 | $148,900 | $263,700 |
| 2018 | $4,635 | $394,500 | $141,700 | $252,800 |
| 2017 | $4,567 | $379,300 | $136,300 | $243,000 |
| 2016 | $4,626 | $379,800 | $133,700 | $246,100 |
| 2015 | $4,573 | $376,400 | $133,700 | $242,700 |
Source: Public Records
Map
Nearby Homes
- 32 Green St
- 11 Lawton St
- 32 Cedar St
- 2 Washburn Ave
- 24 Middle St
- 58 Washington St
- 0 Nulands Neck Unit 73286360
- 8 Washington St
- 145 Pleasant St
- 39 Christian St
- 77 Adams St
- 67 Bridge St
- 8 Manor Dr
- 181 Washington St
- 138 Main St Unit 13
- 16 Ash St
- 15 School St
- 58 Bayview Ave
- 24 Academy Ave
- 27 Bayview Ave
Your Personal Tour Guide
Ask me questions while you tour the home.