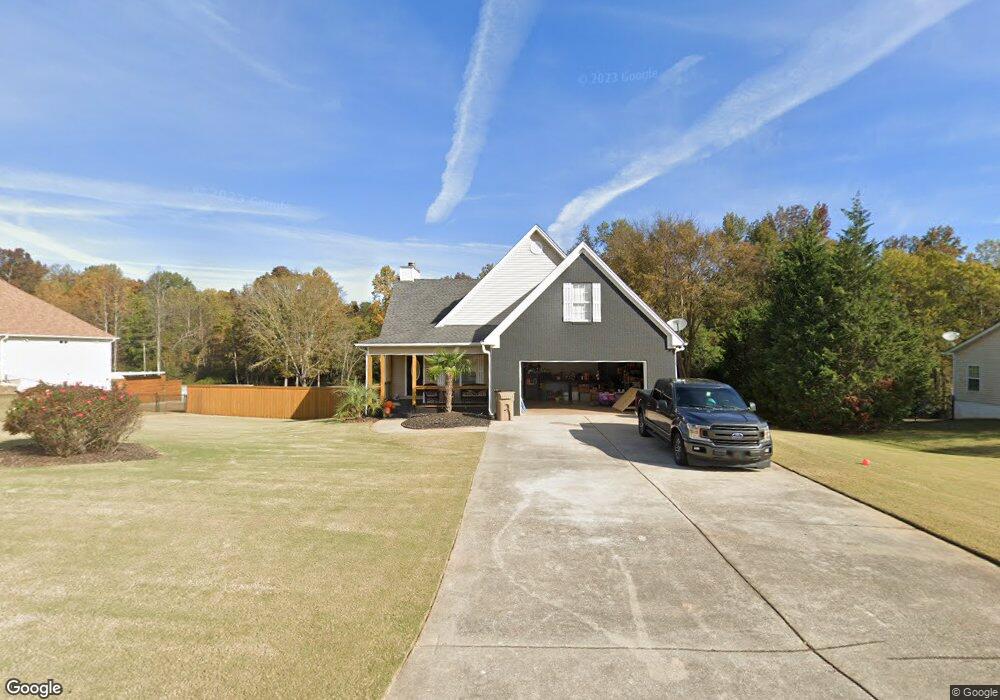
62 Margie Ct Hoschton, GA 30548
Estimated Value: $374,000 - $454,000
--
Bed
2
Baths
1,465
Sq Ft
$274/Sq Ft
Est. Value
About This Home
This home is located at 62 Margie Ct, Hoschton, GA 30548 and is currently estimated at $401,248, approximately $273 per square foot. 62 Margie Ct is a home located in Jackson County with nearby schools including Gum Springs Elementary School, West Jackson Middle School, and Jackson County High School.
Ownership History
Date
Name
Owned For
Owner Type
Purchase Details
Closed on
May 28, 2020
Sold by
Poddar Satish
Bought by
Carroll Mark J
Current Estimated Value
Purchase Details
Closed on
Sep 24, 2008
Sold by
Sas Prospectors
Bought by
Poddar Satish
Home Financials for this Owner
Home Financials are based on the most recent Mortgage that was taken out on this home.
Original Mortgage
$105,600
Interest Rate
6.36%
Mortgage Type
New Conventional
Purchase Details
Closed on
Jan 2, 2008
Sold by
Wells Fargo Bank
Bought by
Sec Of Housing & Urban
Purchase Details
Closed on
Apr 25, 2003
Sold by
Gadell Inc
Bought by
Myers James R
Purchase Details
Closed on
May 17, 2002
Sold by
Buckeye Land & Timber Inc & Gadell Inc
Bought by
Gadell Inc
Create a Home Valuation Report for This Property
The Home Valuation Report is an in-depth analysis detailing your home's value as well as a comparison with similar homes in the area
Home Values in the Area
Average Home Value in this Area
Purchase History
| Date | Buyer | Sale Price | Title Company |
|---|---|---|---|
| Carroll Mark J | $31,561 | -- | |
| Poddar Satish | $132,000 | -- | |
| Sas Prospectors | $132,000 | -- | |
| Sec Of Housing & Urban | $181,440 | -- | |
| Wells Fargo Bank | $181,440 | -- | |
| Myers James R | $174,900 | -- | |
| Gadell Inc | $174,000 | -- |
Source: Public Records
Mortgage History
| Date | Status | Borrower | Loan Amount |
|---|---|---|---|
| Previous Owner | Sas Prospectors | $105,600 |
Source: Public Records
Tax History Compared to Growth
Tax History
| Year | Tax Paid | Tax Assessment Tax Assessment Total Assessment is a certain percentage of the fair market value that is determined by local assessors to be the total taxable value of land and additions on the property. | Land | Improvement |
|---|---|---|---|---|
| 2024 | $3,049 | $124,120 | $20,000 | $104,120 |
| 2023 | $3,049 | $104,200 | $20,000 | $84,200 |
| 2022 | $2,213 | $78,600 | $8,000 | $70,600 |
| 2021 | $1,912 | $67,280 | $8,000 | $59,280 |
| 2020 | $1,856 | $57,760 | $8,000 | $49,760 |
| 2019 | $1,883 | $57,760 | $8,000 | $49,760 |
| 2018 | $1,832 | $55,320 | $8,000 | $47,320 |
| 2017 | $1,785 | $53,310 | $8,000 | $45,310 |
| 2016 | $1,795 | $53,310 | $8,000 | $45,310 |
| 2015 | $1,803 | $53,310 | $8,000 | $45,310 |
| 2014 | $1,487 | $43,218 | $8,000 | $35,218 |
| 2013 | -- | $41,016 | $8,000 | $33,016 |
Source: Public Records
Map
Nearby Homes