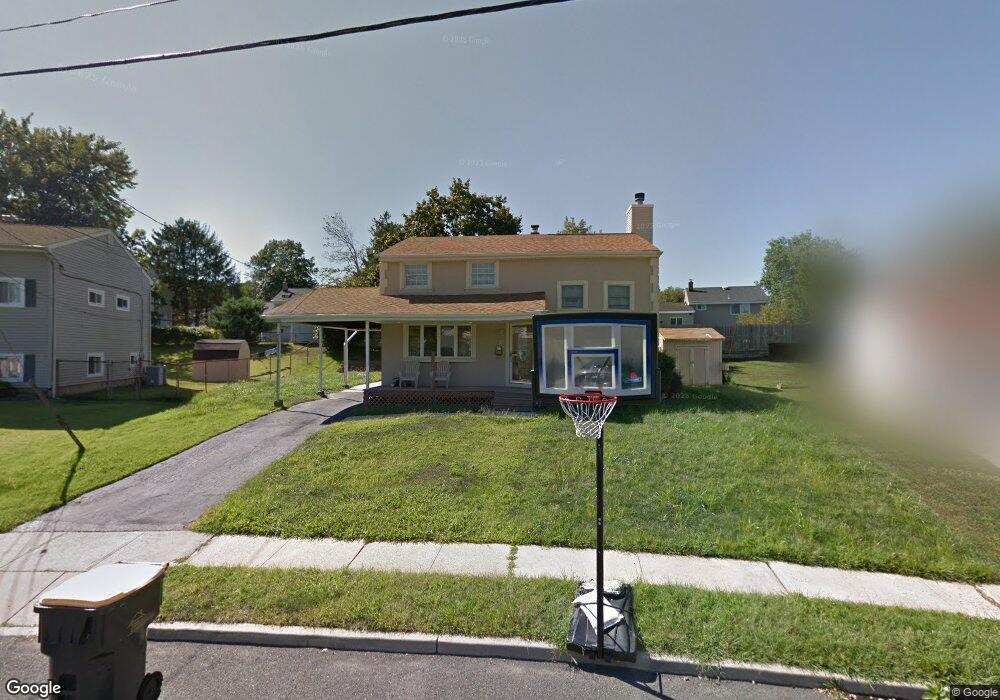
62 Mercury Cir South Amboy, NJ 08879
Estimated Value: $580,000 - $680,000
4
Beds
3
Baths
1,792
Sq Ft
$355/Sq Ft
Est. Value
About This Home
This home is located at 62 Mercury Cir, South Amboy, NJ 08879 and is currently estimated at $635,853, approximately $354 per square foot. 62 Mercury Cir is a home located in Middlesex County with nearby schools including Old Bridge High School, Minding Miracles Learning Center, and Matawan Montessori Academy.
Ownership History
Date
Name
Owned For
Owner Type
Purchase Details
Closed on
Nov 23, 2016
Sold by
Lynx Asset Dervices Llc
Bought by
Welch Brian W
Current Estimated Value
Home Financials for this Owner
Home Financials are based on the most recent Mortgage that was taken out on this home.
Original Mortgage
$288,450
Outstanding Balance
$235,295
Interest Rate
3.94%
Mortgage Type
New Conventional
Estimated Equity
$400,558
Purchase Details
Closed on
Aug 12, 2015
Sold by
Stroud Loftus Marc and Stroud Angela M
Bought by
Lynx Asset Services Llc
Purchase Details
Closed on
Sep 21, 2001
Sold by
Hancheck John
Bought by
Stroud Loftus and Stroud Angela
Home Financials for this Owner
Home Financials are based on the most recent Mortgage that was taken out on this home.
Original Mortgage
$233,700
Interest Rate
6.93%
Create a Home Valuation Report for This Property
The Home Valuation Report is an in-depth analysis detailing your home's value as well as a comparison with similar homes in the area
Home Values in the Area
Average Home Value in this Area
Purchase History
| Date | Buyer | Sale Price | Title Company |
|---|---|---|---|
| Welch Brian W | $320,500 | Red Bank Title Agency | |
| Lynx Asset Services Llc | $396,218 | None Available | |
| Stroud Loftus | $246,170 | -- | |
| -- | $246,200 | -- |
Source: Public Records
Mortgage History
| Date | Status | Borrower | Loan Amount |
|---|---|---|---|
| Open | Welch Brian W | $288,450 | |
| Previous Owner | -- | $233,700 |
Source: Public Records
Tax History Compared to Growth
Tax History
| Year | Tax Paid | Tax Assessment Tax Assessment Total Assessment is a certain percentage of the fair market value that is determined by local assessors to be the total taxable value of land and additions on the property. | Land | Improvement |
|---|---|---|---|---|
| 2025 | $8,283 | $144,100 | $58,400 | $85,700 |
| 2024 | $7,957 | $144,100 | $58,400 | $85,700 |
| 2023 | $7,957 | $144,100 | $58,400 | $85,700 |
| 2022 | $7,711 | $144,100 | $58,400 | $85,700 |
| 2021 | $7,584 | $144,100 | $58,400 | $85,700 |
| 2020 | $7,492 | $144,100 | $58,400 | $85,700 |
| 2019 | $7,376 | $144,100 | $58,400 | $85,700 |
| 2018 | $7,287 | $144,100 | $58,400 | $85,700 |
| 2017 | $7,064 | $144,100 | $58,400 | $85,700 |
| 2016 | $6,660 | $138,700 | $58,400 | $80,300 |
| 2015 | $6,548 | $138,700 | $58,400 | $80,300 |
| 2014 | $6,480 | $138,700 | $58,400 | $80,300 |
Source: Public Records
Map
Nearby Homes