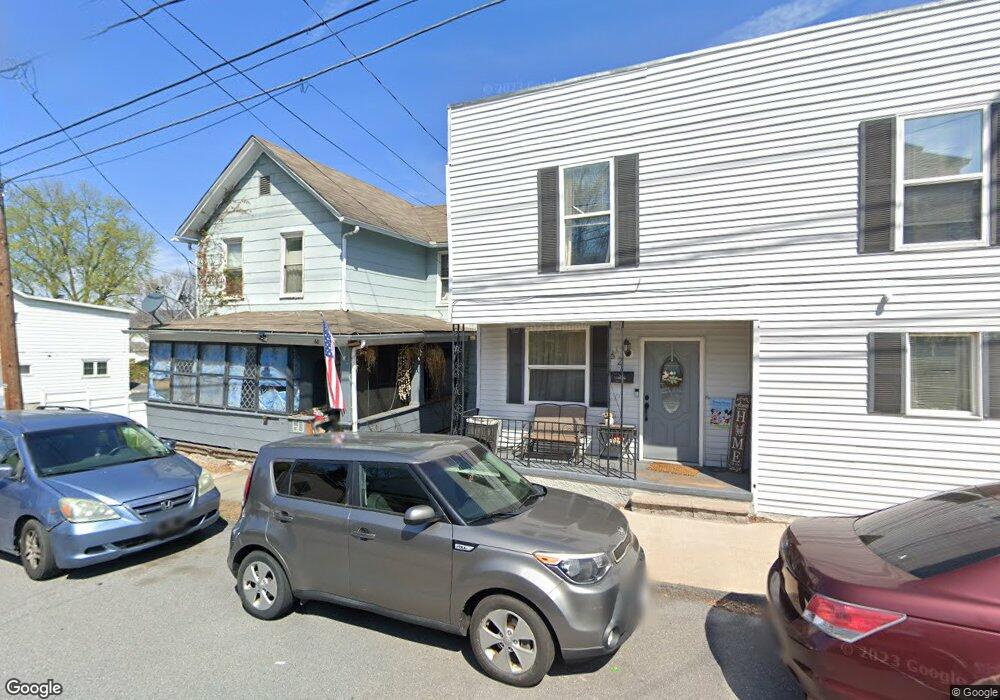
62 Mill St Pittston, PA 18640
Estimated Value: $103,000 - $171,000
--
Bed
--
Bath
1,227
Sq Ft
$115/Sq Ft
Est. Value
About This Home
This home is located at 62 Mill St, Pittston, PA 18640 and is currently estimated at $140,872, approximately $114 per square foot. 62 Mill St is a home located in Luzerne County with nearby schools including Pittston City Intermediate Center, Pittston Area Middle School, and Pittston Area Senior High School.
Ownership History
Date
Name
Owned For
Owner Type
Purchase Details
Closed on
Apr 9, 2020
Sold by
Risch Verlean and Winslow Verlean
Bought by
Fleming Joshua S
Current Estimated Value
Home Financials for this Owner
Home Financials are based on the most recent Mortgage that was taken out on this home.
Original Mortgage
$51,843
Outstanding Balance
$46,325
Interest Rate
3.87%
Mortgage Type
FHA
Estimated Equity
$94,547
Purchase Details
Closed on
Jun 17, 1997
Bought by
Risch Verlean
Create a Home Valuation Report for This Property
The Home Valuation Report is an in-depth analysis detailing your home's value as well as a comparison with similar homes in the area
Home Values in the Area
Average Home Value in this Area
Purchase History
| Date | Buyer | Sale Price | Title Company |
|---|---|---|---|
| Fleming Joshua S | $52,800 | Blue Star Setmnt Svcs Llc | |
| Risch Verlean | $55,000 | -- |
Source: Public Records
Mortgage History
| Date | Status | Borrower | Loan Amount |
|---|---|---|---|
| Open | Fleming Joshua S | $51,843 |
Source: Public Records
Tax History Compared to Growth
Tax History
| Year | Tax Paid | Tax Assessment Tax Assessment Total Assessment is a certain percentage of the fair market value that is determined by local assessors to be the total taxable value of land and additions on the property. | Land | Improvement |
|---|---|---|---|---|
| 2025 | $1,672 | $56,200 | $17,400 | $38,800 |
| 2024 | $1,672 | $56,200 | $17,400 | $38,800 |
| 2023 | $1,672 | $56,200 | $17,400 | $38,800 |
| 2022 | $1,661 | $56,200 | $17,400 | $38,800 |
| 2021 | $1,661 | $56,200 | $17,400 | $38,800 |
| 2020 | $1,630 | $56,200 | $17,400 | $38,800 |
| 2019 | $1,619 | $56,200 | $17,400 | $38,800 |
| 2018 | $1,591 | $56,200 | $17,400 | $38,800 |
| 2017 | $1,563 | $56,200 | $17,400 | $38,800 |
| 2016 | -- | $56,200 | $17,400 | $38,800 |
| 2015 | $873 | $56,200 | $17,400 | $38,800 |
| 2014 | $873 | $56,200 | $17,400 | $38,800 |
Source: Public Records
Map
Nearby Homes