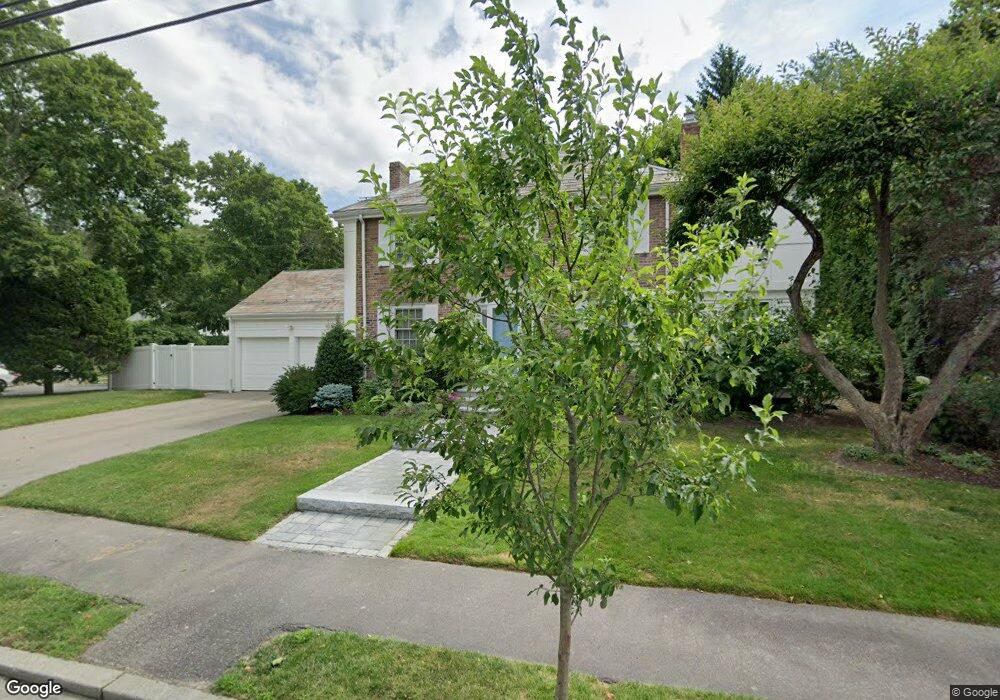
62 Olde Field Rd Newton Center, MA 02459
Thompsonville NeighborhoodEstimated Value: $1,632,000 - $1,970,000
3
Beds
3
Baths
2,559
Sq Ft
$707/Sq Ft
Est. Value
About This Home
This home is located at 62 Olde Field Rd, Newton Center, MA 02459 and is currently estimated at $1,809,867, approximately $707 per square foot. 62 Olde Field Rd is a home located in Middlesex County with nearby schools including Bowen School, Countryside Elementary School, and Charles E Brown Middle School.
Ownership History
Date
Name
Owned For
Owner Type
Purchase Details
Closed on
Sep 10, 2024
Sold by
Kay Jonathan and Kay Deborah A
Bought by
Jonathan Kay T and Jonathan Kay
Current Estimated Value
Purchase Details
Closed on
Jun 25, 1993
Sold by
Hechtman Danielh and Hechtman Joan D
Bought by
Kay Jonathan and Kay Deborah A
Purchase Details
Closed on
May 15, 1990
Sold by
Rice Sydney
Bought by
Hechtman Daniel H
Create a Home Valuation Report for This Property
The Home Valuation Report is an in-depth analysis detailing your home's value as well as a comparison with similar homes in the area
Home Values in the Area
Average Home Value in this Area
Purchase History
| Date | Buyer | Sale Price | Title Company |
|---|---|---|---|
| Jonathan Kay T | -- | None Available | |
| Jonathan Kay T | -- | None Available | |
| Kay Jonathan | $329,500 | -- | |
| Hechtman Daniel H | $306,500 | -- | |
| Kay Jonathan | $329,500 | -- | |
| Hechtman Daniel H | $306,500 | -- |
Source: Public Records
Mortgage History
| Date | Status | Borrower | Loan Amount |
|---|---|---|---|
| Previous Owner | Hechtman Daniel H | $50,000 | |
| Previous Owner | Hechtman Daniel H | $337,500 |
Source: Public Records
Tax History Compared to Growth
Tax History
| Year | Tax Paid | Tax Assessment Tax Assessment Total Assessment is a certain percentage of the fair market value that is determined by local assessors to be the total taxable value of land and additions on the property. | Land | Improvement |
|---|---|---|---|---|
| 2025 | $13,813 | $1,409,500 | $952,800 | $456,700 |
| 2024 | $13,356 | $1,368,400 | $925,000 | $443,400 |
| 2023 | $12,723 | $1,249,800 | $710,900 | $538,900 |
| 2022 | $12,174 | $1,157,200 | $658,200 | $499,000 |
| 2021 | $11,747 | $1,091,700 | $620,900 | $470,800 |
| 2020 | $11,397 | $1,091,700 | $620,900 | $470,800 |
| 2019 | $11,076 | $1,059,900 | $602,800 | $457,100 |
| 2018 | $10,679 | $987,000 | $547,300 | $439,700 |
| 2017 | $10,354 | $931,100 | $516,300 | $414,800 |
| 2016 | $9,903 | $870,200 | $482,500 | $387,700 |
| 2015 | $9,442 | $813,300 | $450,900 | $362,400 |
Source: Public Records
Map
Nearby Homes
- 35 Haynes Rd
- 21 Philbrick Rd
- 85 Dudley Rd
- 45 Brandeis Rd
- 19 Selwyn Rd
- 628 Boylston St
- 625 Boylston St
- 42 Sunhill Ln
- 136 Dudley Rd
- 671 Boylston St
- 42 Bow Rd
- 5 Halcyon Rd
- 125 Oakdale Rd
- 250 Woodcliff Rd
- 38 Tanglewood Rd
- 79 Florence St Unit 600S
- 79 Florence St Unit 402S
- 20 Hamlet St
- 20 Hamlet St Unit 1
- 36 Cannon St