D
Landlord's Agent in 2021
Daniel Mundo
Compass
(201) 286-2258
1 in this area
18 Total Sales


Estimated Value: $452,000 - $515,000
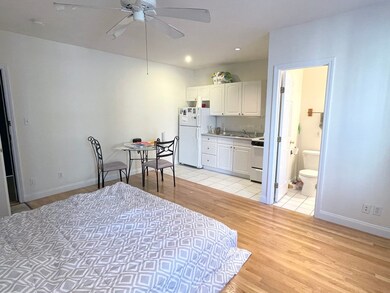
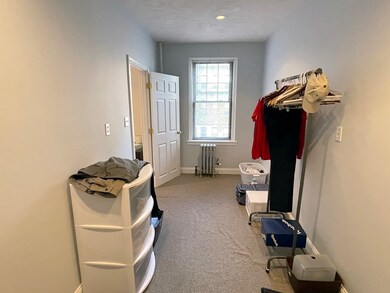
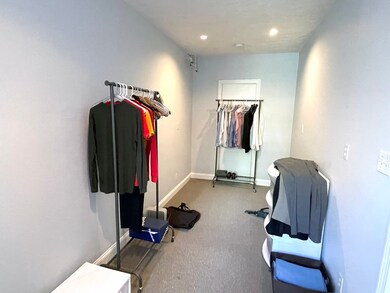
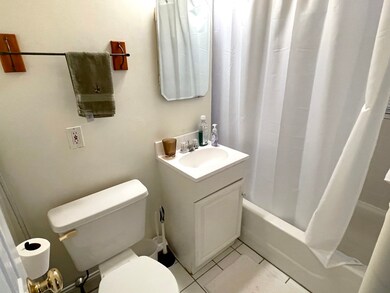
Professionally managed condo in the charming Queensberry Court! Complete with hardwood flooring in the living room, tiled kitchen and bath, and recessed lighting. Close to Longwood Medical, local universities, shops/ restaurants of the Fenway!
Last Renter's Agent
Teresa Pontes
eXp Realty

Property Type
Other
Est. Annual Taxes
$5,048
Year Built
1910
Lot Details
0
| Date | Buyer | Sale Price | Title Company |
|---|---|---|---|
| Sound Props Holdings L | $309,000 | -- | |
| D&G Rt | $46,000 | -- |
| Date | Event | Price | List to Sale | Price per Sq Ft |
|---|---|---|---|---|
| 07/25/2021 07/25/21 | Rented | $1,900 | 0.0% | -- |
| 07/13/2021 07/13/21 | Under Contract | -- | -- | -- |
| 06/03/2021 06/03/21 | For Rent | $1,900 | -- | -- |
| Year | Tax Paid | Tax Assessment Tax Assessment Total Assessment is a certain percentage of the fair market value that is determined by local assessors to be the total taxable value of land and additions on the property. | Land | Improvement |
|---|---|---|---|---|
| 2025 | $5,048 | $435,900 | $0 | $435,900 |
| 2024 | $4,704 | $431,600 | $0 | $431,600 |
| 2023 | $4,497 | $418,700 | $0 | $418,700 |
| 2022 | $4,467 | $410,600 | $0 | $410,600 |
| 2021 | $4,296 | $402,600 | $0 | $402,600 |
| 2020 | $3,870 | $366,500 | $0 | $366,500 |
| 2019 | $3,611 | $342,600 | $0 | $342,600 |
| 2018 | $3,325 | $317,300 | $0 | $317,300 |
| 2017 | $3,198 | $302,000 | $0 | $302,000 |
| 2016 | $3,165 | $287,700 | $0 | $287,700 |
| 2015 | $2,934 | $242,300 | $0 | $242,300 |
| 2014 | $2,637 | $209,600 | $0 | $209,600 |
D
Landlord's Agent in 2021
Daniel Mundo
Compass
(201) 286-2258
1 in this area
18 Total Sales
T
Tenant's Agent in 2021
Teresa Pontes
eXp Realty
Source: MLS Property Information Network (MLS PIN)
MLS Number: 72843234
APN: CBOS-000000-000005-004283-000140
Disclaimer: Certain information contained herein is derived from information provided by parties other than Homes.com. All information provided is deemed reliable, but is not guaranteed to be accurate and should be independently verified.
![]() The property listing data and information, or the Images, set forth herein were provided to MLS Property Information Network, Inc. from third party sources, including sellers, lessors and public records, and were compiled by MLS Property Information Network, Inc. The property listing data and information, and the Images, are for the personal, non-commercial use of consumers having a good faith interest in purchasing or leasing listed properties of the type displayed to them and may not be used for any purpose other than to identify prospective properties which such consumers may have a good faith interest in purchasing or leasing. MLS Property Information Network, Inc. and its subscribers disclaim any and all representations and warranties as to the accuracy of the property listing data and information, or as to the accuracy of any of the Images, set forth herein.
The property listing data and information, or the Images, set forth herein were provided to MLS Property Information Network, Inc. from third party sources, including sellers, lessors and public records, and were compiled by MLS Property Information Network, Inc. The property listing data and information, and the Images, are for the personal, non-commercial use of consumers having a good faith interest in purchasing or leasing listed properties of the type displayed to them and may not be used for any purpose other than to identify prospective properties which such consumers may have a good faith interest in purchasing or leasing. MLS Property Information Network, Inc. and its subscribers disclaim any and all representations and warranties as to the accuracy of the property listing data and information, or as to the accuracy of any of the Images, set forth herein.