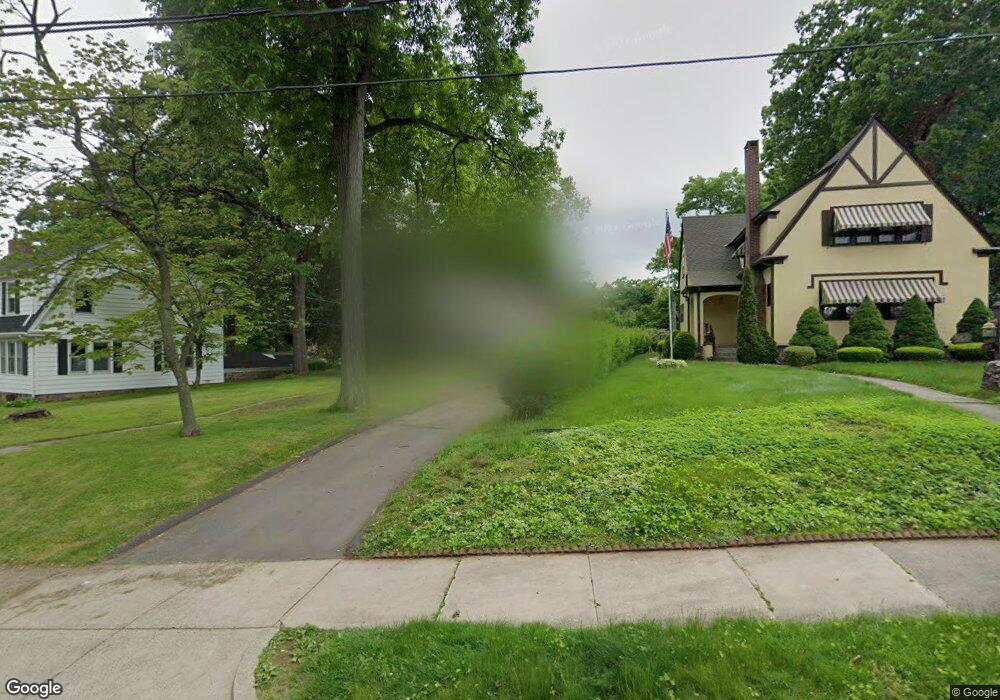
62 Russwin Rd Unit Rd New Britain, CT 06053
Estimated Value: $321,000 - $364,000
4
Beds
2
Baths
1,940
Sq Ft
$178/Sq Ft
Est. Value
About This Home
This home is located at 62 Russwin Rd Unit Rd, New Britain, CT 06053 and is currently estimated at $346,061, approximately $178 per square foot. 62 Russwin Rd Unit Rd is a home located in Hartford County with nearby schools including Gaffney School, Slade Middle School, and Mountain Laurel Sudbury School.
Ownership History
Date
Name
Owned For
Owner Type
Purchase Details
Closed on
Nov 5, 2020
Sold by
Mcdonald John and Mcdonald Catharine M
Bought by
Blango Frederick T and Fenderson Margaret
Current Estimated Value
Home Financials for this Owner
Home Financials are based on the most recent Mortgage that was taken out on this home.
Original Mortgage
$185,250
Outstanding Balance
$163,273
Interest Rate
2.9%
Mortgage Type
New Conventional
Estimated Equity
$182,788
Purchase Details
Closed on
Nov 24, 2008
Sold by
Winkler James W and Winkler Susan C
Bought by
Mcdonald John and Banasiak Catharine
Home Financials for this Owner
Home Financials are based on the most recent Mortgage that was taken out on this home.
Original Mortgage
$207,264
Interest Rate
6.03%
Mortgage Type
Purchase Money Mortgage
Create a Home Valuation Report for This Property
The Home Valuation Report is an in-depth analysis detailing your home's value as well as a comparison with similar homes in the area
Home Values in the Area
Average Home Value in this Area
Purchase History
| Date | Buyer | Sale Price | Title Company |
|---|---|---|---|
| Blango Frederick T | $195,000 | None Available | |
| Blango Frederick T | $195,000 | None Available | |
| Mcdonald John | $210,000 | -- |
Source: Public Records
Mortgage History
| Date | Status | Borrower | Loan Amount |
|---|---|---|---|
| Open | Blango Frederick T | $185,250 | |
| Closed | Blango Frederick T | $185,250 | |
| Previous Owner | Mcdonald John | $196,291 | |
| Previous Owner | Mcdonald John | $207,264 |
Source: Public Records
Tax History
| Year | Tax Paid | Tax Assessment Tax Assessment Total Assessment is a certain percentage of the fair market value that is determined by local assessors to be the total taxable value of land and additions on the property. | Land | Improvement |
|---|---|---|---|---|
| 2025 | $6,922 | $176,680 | $63,280 | $113,400 |
| 2024 | $6,995 | $176,680 | $63,280 | $113,400 |
| 2023 | $6,763 | $176,680 | $63,280 | $113,400 |
| 2022 | $5,748 | $116,130 | $29,120 | $87,010 |
| 2021 | $5,748 | $116,130 | $29,120 | $87,010 |
| 2020 | $5,865 | $116,130 | $29,120 | $87,010 |
| 2019 | $5,865 | $116,130 | $29,120 | $87,010 |
| 2018 | $5,865 | $116,130 | $29,120 | $87,010 |
| 2017 | $5,186 | $102,690 | $24,290 | $78,400 |
| 2016 | $5,186 | $102,690 | $24,290 | $78,400 |
| 2015 | $5,032 | $102,690 | $24,290 | $78,400 |
| 2014 | $5,032 | $102,690 | $24,290 | $78,400 |
Source: Public Records
Map
Nearby Homes
- 7 Ledyard Rd
- 37 Richard St
- 94 Pennsylvania Ave
- 54 Fairlane Dr
- 18 Woodruff Ct
- 962 Corbin Ave
- 33 Colt St
- 134 Black Rock Ave
- 170 Garry Dr
- 55 Dogwood Dr
- 376 Broad St
- 32 Garden St
- 66 Lincoln St
- 112 Lincoln St
- 240 Hillhurst Ave
- 25 Clinton St
- 230 Hillhurst Ave
- 29 S Mountain Dr
- 23 Smith St Unit 1B
- 164 Curtis St
Your Personal Tour Guide
Ask me questions while you tour the home.