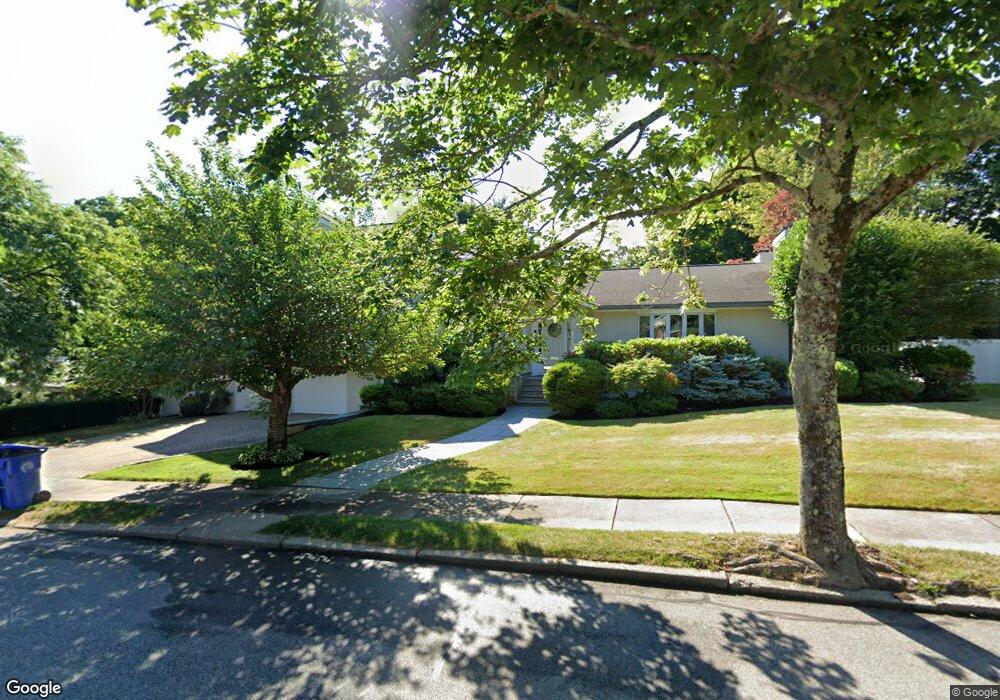
62 Sharpe Rd Newton Center, MA 02459
Oak Hill NeighborhoodEstimated Value: $2,970,000 - $3,709,000
4
Beds
5
Baths
4,232
Sq Ft
$776/Sq Ft
Est. Value
About This Home
This home is located at 62 Sharpe Rd, Newton Center, MA 02459 and is currently estimated at $3,284,386, approximately $776 per square foot. 62 Sharpe Rd is a home located in Middlesex County with nearby schools including Countryside Elementary School, Memorial Spaulding Elementary School, and Charles E Brown Middle School.
Ownership History
Date
Name
Owned For
Owner Type
Purchase Details
Closed on
Dec 24, 2001
Sold by
Zises Sheryl R
Bought by
Sharpe Nt and Cutler Robert J
Current Estimated Value
Home Financials for this Owner
Home Financials are based on the most recent Mortgage that was taken out on this home.
Original Mortgage
$2,000,000
Outstanding Balance
$779,766
Interest Rate
6.54%
Mortgage Type
Purchase Money Mortgage
Estimated Equity
$2,504,620
Create a Home Valuation Report for This Property
The Home Valuation Report is an in-depth analysis detailing your home's value as well as a comparison with similar homes in the area
Home Values in the Area
Average Home Value in this Area
Purchase History
| Date | Buyer | Sale Price | Title Company |
|---|---|---|---|
| Sharpe Nt | $2,800,000 | -- |
Source: Public Records
Mortgage History
| Date | Status | Borrower | Loan Amount |
|---|---|---|---|
| Open | Sharpe Nt | $2,000,000 |
Source: Public Records
Tax History Compared to Growth
Tax History
| Year | Tax Paid | Tax Assessment Tax Assessment Total Assessment is a certain percentage of the fair market value that is determined by local assessors to be the total taxable value of land and additions on the property. | Land | Improvement |
|---|---|---|---|---|
| 2025 | $33,391 | $3,407,200 | $1,173,400 | $2,233,800 |
| 2024 | $32,286 | $3,308,000 | $1,139,200 | $2,168,800 |
| 2023 | $31,206 | $3,065,400 | $894,500 | $2,170,900 |
| 2022 | $29,859 | $2,838,300 | $828,200 | $2,010,100 |
| 2021 | $28,811 | $2,677,600 | $781,300 | $1,896,300 |
| 2020 | $27,954 | $2,677,600 | $781,300 | $1,896,300 |
| 2019 | $27,166 | $2,599,600 | $758,500 | $1,841,100 |
| 2018 | $26,368 | $2,437,000 | $689,000 | $1,748,000 |
| 2017 | $25,566 | $2,299,100 | $650,000 | $1,649,100 |
| 2016 | $24,452 | $2,148,700 | $607,500 | $1,541,200 |
| 2015 | $23,314 | $2,008,100 | $567,800 | $1,440,300 |
Source: Public Records
Map
Nearby Homes
- 58 Country Club Rd
- 415 Dedham St Unit D
- 65 Levbert Rd
- 15 Buff Cir
- 45 Brandeis Rd
- 36 Cannon St
- 41 Juniper Ln
- 135 Hartman Rd
- 250 Woodcliff Rd
- 59 Deborah Rd
- 35 Haynes Rd
- 19 Selwyn Rd
- 56 Cynthia Rd
- 207 Nahanton St Unit 207
- 36 Ober Rd
- 44 Lovett Rd
- 63 Drumlin Rd
- 21 Philbrick Rd
- 628 Boylston St
- 21 Lovett Rd