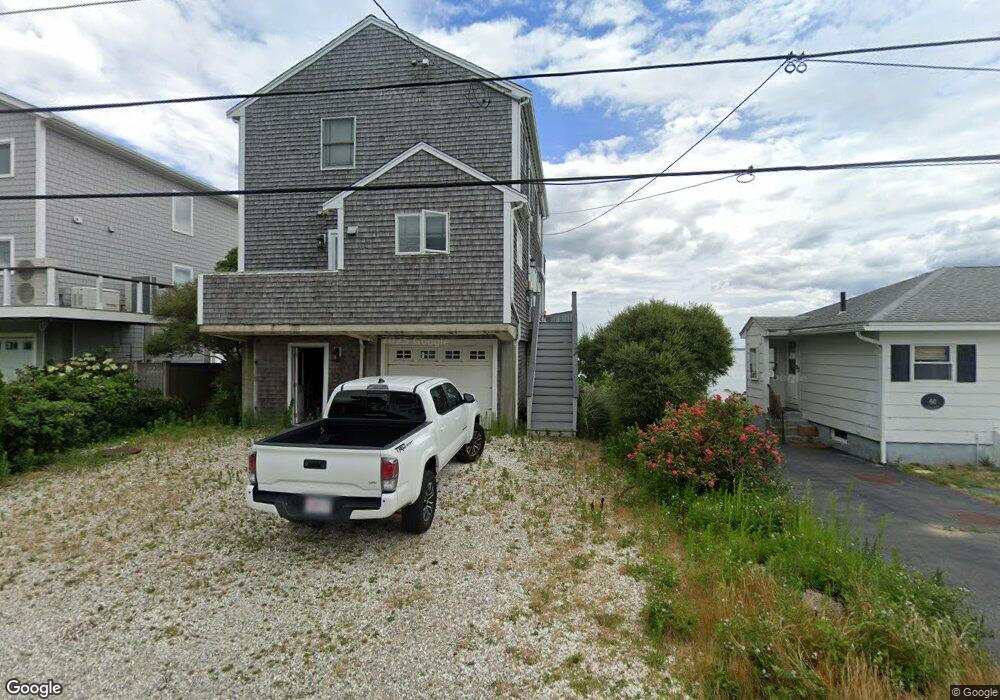
62 Shore Dr Mattapoisett, MA 02739
Estimated Value: $922,000 - $1,221,000
2
Beds
3
Baths
1,788
Sq Ft
$599/Sq Ft
Est. Value
About This Home
This home is located at 62 Shore Dr, Mattapoisett, MA 02739 and is currently estimated at $1,071,550, approximately $599 per square foot. 62 Shore Dr is a home located in Plymouth County with nearby schools including Center School, Old Hammondtown Elementary, and Old Rochester Regional High School.
Ownership History
Date
Name
Owned For
Owner Type
Purchase Details
Closed on
Apr 9, 2002
Sold by
Watts Ft and Hurley
Bought by
Baker August J and Apovian Caroline M
Current Estimated Value
Home Financials for this Owner
Home Financials are based on the most recent Mortgage that was taken out on this home.
Original Mortgage
$275,000
Outstanding Balance
$112,020
Interest Rate
6.85%
Mortgage Type
Purchase Money Mortgage
Estimated Equity
$959,530
Create a Home Valuation Report for This Property
The Home Valuation Report is an in-depth analysis detailing your home's value as well as a comparison with similar homes in the area
Home Values in the Area
Average Home Value in this Area
Purchase History
| Date | Buyer | Sale Price | Title Company |
|---|---|---|---|
| Baker August J | $370,000 | -- | |
| Baker August J | $370,000 | -- |
Source: Public Records
Mortgage History
| Date | Status | Borrower | Loan Amount |
|---|---|---|---|
| Open | Baker August J | $275,000 | |
| Closed | Baker August J | $275,000 |
Source: Public Records
Tax History Compared to Growth
Tax History
| Year | Tax Paid | Tax Assessment Tax Assessment Total Assessment is a certain percentage of the fair market value that is determined by local assessors to be the total taxable value of land and additions on the property. | Land | Improvement |
|---|---|---|---|---|
| 2025 | $10,933 | $1,016,100 | $701,600 | $314,500 |
| 2024 | $10,679 | $1,016,100 | $701,600 | $314,500 |
| 2023 | $11,024 | $979,936 | $686,136 | $293,800 |
| 2022 | $10,857 | $875,528 | $571,528 | $304,000 |
| 2021 | $9,641 | $743,880 | $496,980 | $246,900 |
| 2020 | $5,189 | $698,440 | $473,440 | $225,000 |
| 2019 | $9,170 | $694,200 | $473,600 | $220,600 |
| 2018 | $0 | $737,900 | $502,800 | $235,100 |
| 2017 | $0 | $759,000 | $544,400 | $214,600 |
| 2016 | $9,685 | $733,700 | $523,600 | $210,100 |
| 2015 | $9,070 | $697,700 | $494,400 | $203,300 |
| 2014 | $8,784 | $690,600 | $502,800 | $187,800 |
Source: Public Records
Map
Nearby Homes
- 6 North Rd
- 0 (Lot 2) Hollywoods Rd
- 85 Moorings Rd
- 0 Converse Rd Unit 73451004
- 13 Converse Rd
- 7 Aucoot Rd
- 15 Quelle Ln
- 51 Holly Pond Rd
- 11 Bay Rd
- 0 (Lot D) Angelica Ave
- 4 Olde Logging Rd
- 11 Cove St
- 8 Channel St
- 7 Upland Way
- 0 Beach St
- 27 Beach St
- 3 Rock St
- 1 Angelica Ave
- 6 Ocean Breeze Ln
- 25 West Ave