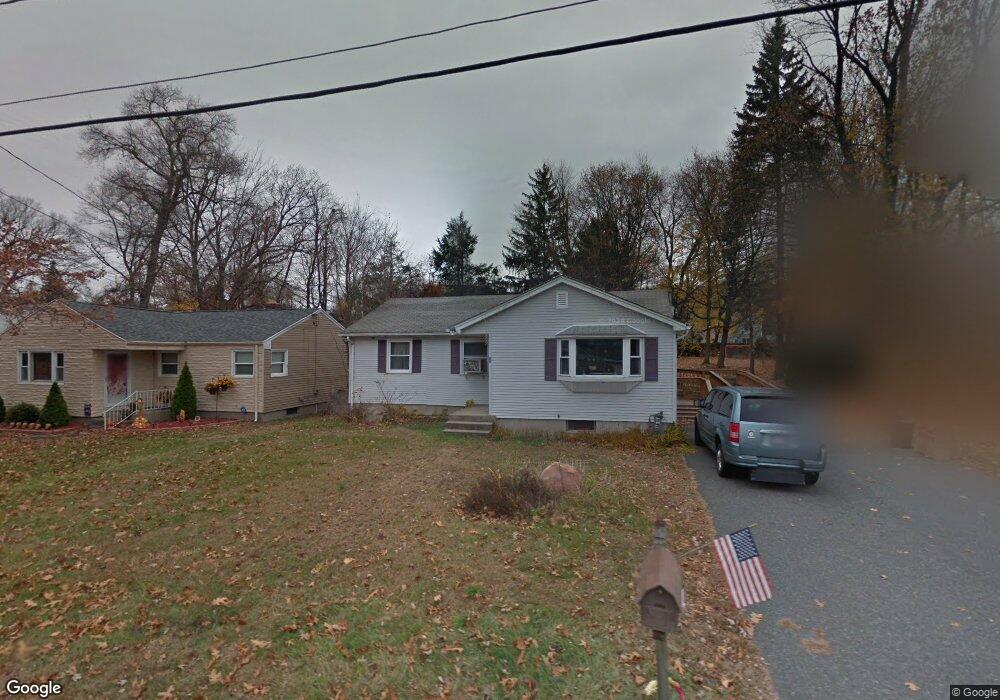
62 Smyrna St West Springfield, MA 01089
Estimated Value: $307,000 - $365,574
4
Beds
2
Baths
1,566
Sq Ft
$218/Sq Ft
Est. Value
About This Home
This home is located at 62 Smyrna St, West Springfield, MA 01089 and is currently estimated at $340,894, approximately $217 per square foot. 62 Smyrna St is a home located in Hampden County with nearby schools including Hampden Charter School of Science West and St Thomas The Apostle School.
Ownership History
Date
Name
Owned For
Owner Type
Purchase Details
Closed on
May 4, 2021
Sold by
Cone Elizabeth L
Bought by
Hegarty Elizabeth L and Hegarty Thomas C
Current Estimated Value
Purchase Details
Closed on
Mar 12, 2015
Sold by
Cone Robert B
Bought by
Cone Elizabeth L
Purchase Details
Closed on
Apr 15, 1999
Sold by
Smith Randall W and Smith Su L
Bought by
Cone Robert B and Cone Elizabeth L
Home Financials for this Owner
Home Financials are based on the most recent Mortgage that was taken out on this home.
Original Mortgage
$104,946
Interest Rate
7.04%
Mortgage Type
Purchase Money Mortgage
Create a Home Valuation Report for This Property
The Home Valuation Report is an in-depth analysis detailing your home's value as well as a comparison with similar homes in the area
Home Values in the Area
Average Home Value in this Area
Purchase History
| Date | Buyer | Sale Price | Title Company |
|---|---|---|---|
| Hegarty Elizabeth L | -- | None Available | |
| Cone Elizabeth L | -- | -- | |
| Cone Robert B | $105,000 | -- |
Source: Public Records
Mortgage History
| Date | Status | Borrower | Loan Amount |
|---|---|---|---|
| Previous Owner | Cone Robert B | $25,000 | |
| Previous Owner | Cone Robert B | $104,946 | |
| Previous Owner | Cone Robert B | $102,500 |
Source: Public Records
Tax History Compared to Growth
Tax History
| Year | Tax Paid | Tax Assessment Tax Assessment Total Assessment is a certain percentage of the fair market value that is determined by local assessors to be the total taxable value of land and additions on the property. | Land | Improvement |
|---|---|---|---|---|
| 2025 | $4,297 | $289,000 | $108,000 | $181,000 |
| 2024 | $4,239 | $286,200 | $108,000 | $178,200 |
| 2023 | $4,026 | $259,100 | $108,000 | $151,100 |
| 2022 | $3,530 | $224,000 | $98,000 | $126,000 |
| 2021 | $3,388 | $200,500 | $90,700 | $109,800 |
| 2020 | $3,406 | $200,500 | $90,700 | $109,800 |
| 2019 | $3,400 | $200,500 | $90,700 | $109,800 |
| 2018 | $3,419 | $200,500 | $90,700 | $109,800 |
| 2017 | $3,419 | $200,500 | $90,700 | $109,800 |
| 2016 | $3,373 | $198,500 | $87,200 | $111,300 |
| 2015 | $3,306 | $194,600 | $85,400 | $109,200 |
| 2014 | $802 | $194,600 | $85,400 | $109,200 |
Source: Public Records
Map
Nearby Homes