
Landlord's Agent in 2025
Sharon Robie
Modern Realty Group
(201) 693-0125
13 in this area
56 Total Sales
Estimated Value: $794,000 - $912,386
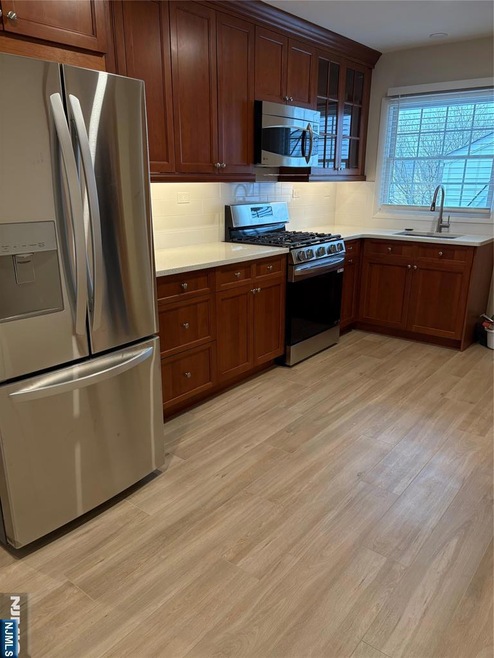
Newly Renovated Beautiful Large 3 bedroom 1.5 bath, 2nd Floor Apartment On Quite Street, Laundry in Unit,Gleaming Hardwood Flooring, Large Widows in Living Room,Tons of Natural Light, This lovely unit offers a Large Living Room can be Dining Room Combo, Large Eat in Kitchen plenty of Cabinet Space, 3 Large Bedrooms the Master offers a Half Bath, Central AC, Baseboard Heat,Tenant Responsible of all Utilities, Landlord pays Cold Water, Tenant Must have Rental Insurance, Easy Street Parking, NO PETS Please Do Not Ask, No Use of Yard , Beautiful Park just a few blocks away, Close to Transportation, Major Highways, Schools and Shopping, Come see this Beauty Today
| Date | Buyer | Sale Price | Title Company |
|---|---|---|---|
| Agas Jozef | $320,000 | -- | |
| Drozdz Robert | $28,300 | -- |
| Date | Status | Borrower | Loan Amount |
|---|---|---|---|
| Open | Agas Jozef | $256,000 |
| Date | Event | Price | List to Sale | Price per Sq Ft |
|---|---|---|---|---|
| 04/16/2025 04/16/25 | Off Market | -- | -- | -- |
| 04/08/2025 04/08/25 | Rented | -- | -- | -- |
| 02/05/2025 02/05/25 | Price Changed | $2,700 | -8.5% | -- |
| 12/30/2024 12/30/24 | For Rent | $2,950 | -- | -- |
| Year | Tax Paid | Tax Assessment Tax Assessment Total Assessment is a certain percentage of the fair market value that is determined by local assessors to be the total taxable value of land and additions on the property. | Land | Improvement |
|---|---|---|---|---|
| 2025 | $15,536 | $797,200 | $254,100 | $543,100 |
| 2024 | $14,947 | $456,800 | $159,100 | $297,700 |
| 2023 | $14,636 | $456,800 | $159,100 | $297,700 |
| 2022 | $14,636 | $456,800 | $159,100 | $297,700 |
| 2021 | $14,385 | $456,800 | $159,100 | $297,700 |
| 2020 | $14,092 | $456,800 | $159,100 | $297,700 |
| 2019 | $13,645 | $456,800 | $159,100 | $297,700 |
| 2018 | $13,485 | $456,800 | $159,100 | $297,700 |
| 2017 | $13,316 | $456,800 | $159,100 | $297,700 |
| 2016 | $13,055 | $456,800 | $159,100 | $297,700 |
| 2015 | $12,498 | $456,800 | $159,100 | $297,700 |
| 2014 | $11,859 | $456,800 | $159,100 | $297,700 |
Landlord's Agent in 2025
Sharon Robie
Modern Realty Group
(201) 693-0125
13 in this area
56 Total Sales
Source: New Jersey MLS
MLS Number: 24050864
APN: 65-00051-0000-00002
Disclaimer: Certain information contained herein is derived from information provided by parties other than Homes.com. All information provided is deemed reliable, but is not guaranteed to be accurate and should be independently verified.
![]() The data relating to the real estate for sale on this web site comes in part from the Internet Data Exchange Program of the NJMLS. Real estate listings held by brokerage firms other than Ten-X are marked with the Internet Data Exchange logo and information about them includes the name of the listing brokers. Some properties listed with the participating brokers do not appear on this website at the request of the seller. Listings of brokers that do not participate in Internet Data Exchange do not appear on this website.
The data relating to the real estate for sale on this web site comes in part from the Internet Data Exchange Program of the NJMLS. Real estate listings held by brokerage firms other than Ten-X are marked with the Internet Data Exchange logo and information about them includes the name of the listing brokers. Some properties listed with the participating brokers do not appear on this website at the request of the seller. Listings of brokers that do not participate in Internet Data Exchange do not appear on this website.
All information deemed reliable but not guaranteed. Source: New Jersey Multiple Listing, Inc.
© 2026 New Jersey Multiple Listing Service Inc. All rights reserved.
Ask me questions while you tour the home.