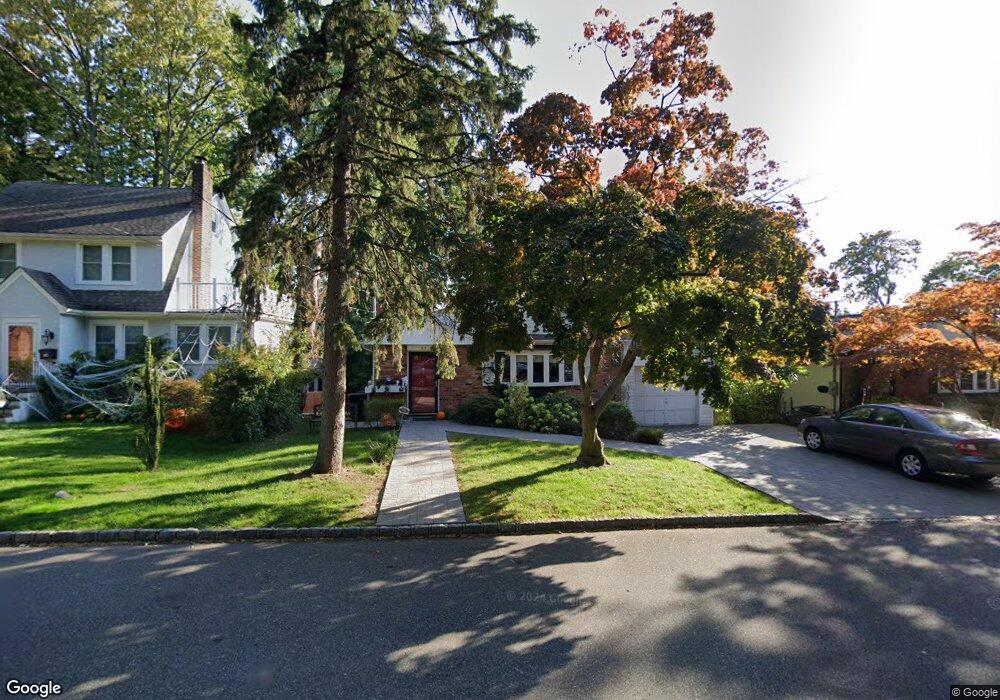
62 Susquehanna Ave Great Neck, NY 11021
Estimated Value: $1,326,763 - $1,442,000
4
Beds
3
Baths
1,296
Sq Ft
$1,068/Sq Ft
Est. Value
About This Home
This home is located at 62 Susquehanna Ave, Great Neck, NY 11021 and is currently estimated at $1,384,382, approximately $1,068 per square foot. 62 Susquehanna Ave is a home located in Nassau County with nearby schools including Saddle Rock School, Great Neck South Middle School, and Richard S. Sherman - Great Neck North Middle School.
Ownership History
Date
Name
Owned For
Owner Type
Purchase Details
Closed on
Oct 4, 2011
Sold by
Solaimani David and Soleimani David
Bought by
Picker Neal and Spitzer-Picker Harriet
Current Estimated Value
Home Financials for this Owner
Home Financials are based on the most recent Mortgage that was taken out on this home.
Original Mortgage
$338,000
Outstanding Balance
$231,084
Interest Rate
4.15%
Mortgage Type
Purchase Money Mortgage
Estimated Equity
$1,153,298
Purchase Details
Closed on
Jul 13, 2009
Sold by
62 Susquehanna Ave Llc
Bought by
Solaimani David
Home Financials for this Owner
Home Financials are based on the most recent Mortgage that was taken out on this home.
Original Mortgage
$390,000
Interest Rate
5.58%
Mortgage Type
Purchase Money Mortgage
Purchase Details
Closed on
Nov 11, 2005
Sold by
Soleimani Bahador
Bought by
62 Susquehanna Ave Llc
Create a Home Valuation Report for This Property
The Home Valuation Report is an in-depth analysis detailing your home's value as well as a comparison with similar homes in the area
Home Values in the Area
Average Home Value in this Area
Purchase History
| Date | Buyer | Sale Price | Title Company |
|---|---|---|---|
| Picker Neal | $670,000 | -- | |
| Solaimani David | -- | -- | |
| 62 Susquehanna Ave Llc | $800,000 | -- |
Source: Public Records
Mortgage History
| Date | Status | Borrower | Loan Amount |
|---|---|---|---|
| Open | Picker Neal | $338,000 | |
| Previous Owner | Solaimani David | $390,000 |
Source: Public Records
Tax History Compared to Growth
Tax History
| Year | Tax Paid | Tax Assessment Tax Assessment Total Assessment is a certain percentage of the fair market value that is determined by local assessors to be the total taxable value of land and additions on the property. | Land | Improvement |
|---|---|---|---|---|
| 2025 | $15,652 | $804 | $397 | $407 |
| 2024 | $4,430 | $791 | $391 | $400 |
| 2023 | $14,790 | $941 | $465 | $476 |
| 2022 | $14,790 | $941 | $465 | $476 |
| 2021 | $13,944 | $930 | $460 | $470 |
| 2020 | $13,081 | $1,127 | $1,123 | $4 |
| 2019 | $11,960 | $1,207 | $1,080 | $127 |
| 2018 | $12,066 | $1,288 | $0 | $0 |
| 2017 | $7,917 | $1,344 | $1,203 | $141 |
| 2016 | $12,265 | $1,344 | $1,203 | $141 |
| 2015 | $4,139 | $1,344 | $1,203 | $141 |
| 2014 | $4,139 | $1,344 | $1,203 | $141 |
| 2013 | $3,548 | $1,207 | $1,203 | $4 |
Source: Public Records
Map
Nearby Homes
- 185 S Middle Neck Rd Unit 1G
- 195 S Middle Neck Rd Unit 2-L
- 180 S Middle Neck Rd Unit 2-A
- 200 S Middle Neck Rd Unit J-6
- 50 Hill Park Ave Unit 2F
- 45 Hill Park Ave Unit Pr2
- 45 Hill Park Ave Unit 2L
- 20 Hill Park Ave Unit 1G
- 90 Schenck Ave Unit 2L
- 92 Manor Dr
- 88 Manor Dr
- 15 Hill Park Ave Unit 1C
- 15 Hill Park Ave Unit 2-C
- 15 Hill Park Ave Unit 2O
- 40 Schenck Ave Unit 1L
- 12 Longview Place
- 75 S Middle Neck Rd Unit 4H
- 37 Brompton Rd Unit 5D
- 100 S Middle Neck Rd Unit 102
- 3 Buckingham Place
- 74 Susquehanna Ave
- 60 Susquehanna Ave
- 50 Susquehanna Ave
- 3 Arbor St
- 5 Arbor St
- 69 Susquehanna Ave
- 61 Susquehanna Ave
- 71 Susquehanna Ave
- 7 Arbor St
- 48 Susquehanna Ave
- 73 Susquehanna Ave
- 73 Susquehanna Ave Unit whole
- 9 Arbor St
- 206 Garden St
- 55 Susquehanna Ave
- 79 Susquehanna Ave
- 212 Garden St
- 46 Susquehanna Ave
- 176 Overlook Ave
- 178 Overlook Ave