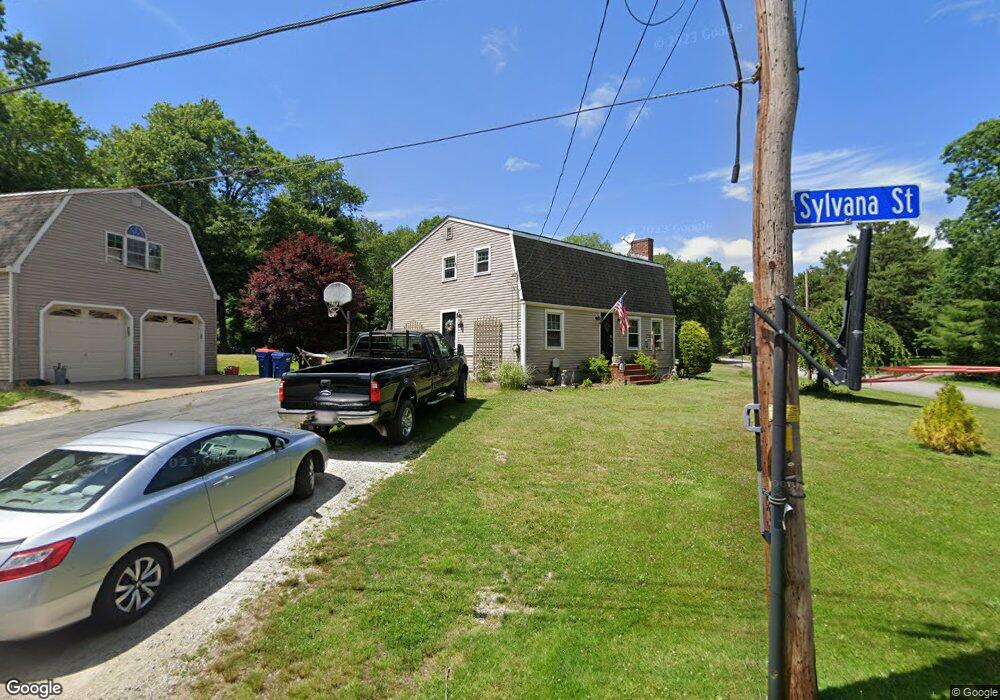
62 Sylvana St Westport, MA 02790
North Westport NeighborhoodEstimated Value: $502,943 - $567,000
4
Beds
--
Bath
1,904
Sq Ft
$277/Sq Ft
Est. Value
About This Home
This home is located at 62 Sylvana St, Westport, MA 02790 and is currently estimated at $526,986, approximately $276 per square foot. 62 Sylvana St is a home located in Bristol County with nearby schools including Alice A. Macomber Primary School, Westport Elementary School, and Westport Middle-High School.
Ownership History
Date
Name
Owned For
Owner Type
Purchase Details
Closed on
Sep 10, 1998
Sold by
Gaspar Sandra L
Bought by
Vasconcellos Kenneth and Vasconellos Stephanie
Current Estimated Value
Home Financials for this Owner
Home Financials are based on the most recent Mortgage that was taken out on this home.
Original Mortgage
$119,600
Interest Rate
6.92%
Mortgage Type
Purchase Money Mortgage
Create a Home Valuation Report for This Property
The Home Valuation Report is an in-depth analysis detailing your home's value as well as a comparison with similar homes in the area
Home Values in the Area
Average Home Value in this Area
Purchase History
| Date | Buyer | Sale Price | Title Company |
|---|---|---|---|
| Vasconcellos Kenneth | $125,900 | -- |
Source: Public Records
Mortgage History
| Date | Status | Borrower | Loan Amount |
|---|---|---|---|
| Open | Vasconcellos Kenneth | $126,525 | |
| Closed | Vasconcellos Kenneth | $128,000 | |
| Closed | Vasconcellos Kenneth | $119,600 | |
| Previous Owner | Vasconcellos Kenneth | $6,000 |
Source: Public Records
Tax History Compared to Growth
Tax History
| Year | Tax Paid | Tax Assessment Tax Assessment Total Assessment is a certain percentage of the fair market value that is determined by local assessors to be the total taxable value of land and additions on the property. | Land | Improvement |
|---|---|---|---|---|
| 2025 | $3,096 | $415,600 | $162,000 | $253,600 |
| 2024 | $3,080 | $398,400 | $150,000 | $248,400 |
| 2023 | $3,038 | $372,300 | $136,700 | $235,600 |
| 2022 | $2,744 | $334,600 | $124,300 | $210,300 |
| 2021 | $2,744 | $318,300 | $113,000 | $205,300 |
| 2020 | $2,644 | $313,700 | $108,400 | $205,300 |
| 2019 | $2,489 | $301,000 | $108,400 | $192,600 |
| 2018 | $2,287 | $279,900 | $116,700 | $163,200 |
| 2017 | $2,164 | $271,500 | $116,700 | $154,800 |
| 2016 | $2,188 | $276,600 | $116,700 | $159,900 |
| 2015 | $2,063 | $260,100 | $116,700 | $143,400 |
Source: Public Records
Map
Nearby Homes