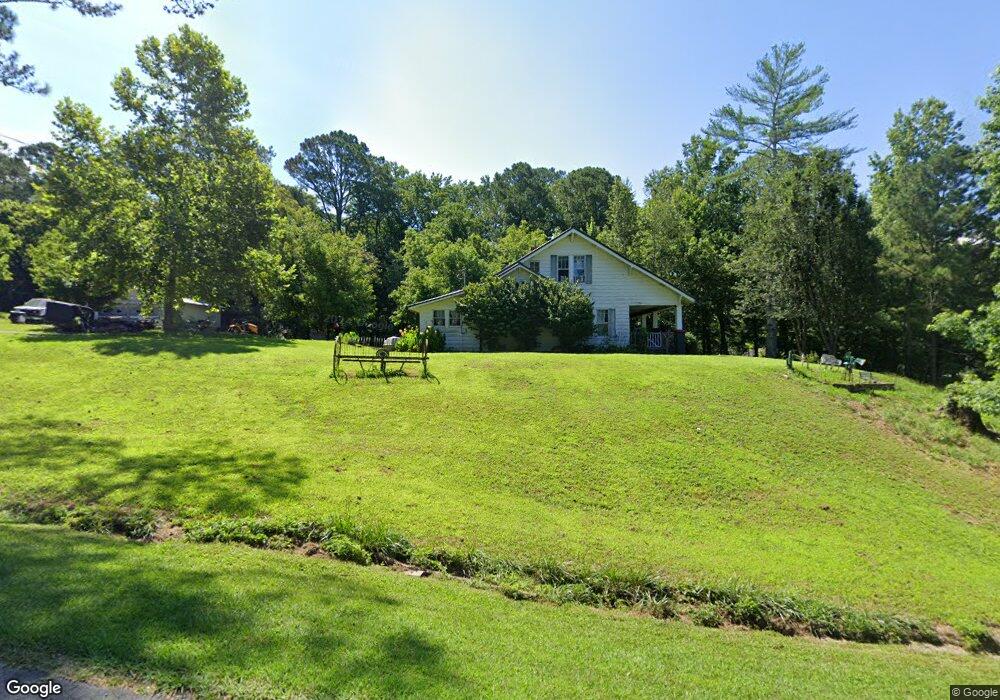
62 Talonah St Talking Rock, GA 30175
Estimated Value: $224,000 - $366,000
--
Bed
2
Baths
2,367
Sq Ft
$130/Sq Ft
Est. Value
About This Home
This home is located at 62 Talonah St, Talking Rock, GA 30175 and is currently estimated at $308,586, approximately $130 per square foot. 62 Talonah St is a home located in Pickens County with nearby schools including Hill City Elementary School, Pickens County Middle School, and Pickens County High School.
Ownership History
Date
Name
Owned For
Owner Type
Purchase Details
Closed on
Jun 25, 2018
Sold by
Young Andy C
Bought by
Young Tiffany M
Current Estimated Value
Purchase Details
Closed on
May 22, 2015
Sold by
Stearns Bank
Bought by
Young Andy C and Young Tiffany M
Home Financials for this Owner
Home Financials are based on the most recent Mortgage that was taken out on this home.
Original Mortgage
$21,102
Interest Rate
3.77%
Mortgage Type
New Conventional
Purchase Details
Closed on
Jul 1, 2014
Sold by
Low Joseph C
Bought by
Stearns Bank
Purchase Details
Closed on
Sep 26, 2008
Sold by
Low Tammy E
Bought by
Low Joseph C
Purchase Details
Closed on
Mar 6, 1997
Bought by
Low Joseph C and Low Tammy E
Purchase Details
Closed on
Jun 30, 1995
Bought by
Low N C
Purchase Details
Closed on
May 2, 1977
Bought by
Low Jewell Bunch Etal
Create a Home Valuation Report for This Property
The Home Valuation Report is an in-depth analysis detailing your home's value as well as a comparison with similar homes in the area
Home Values in the Area
Average Home Value in this Area
Purchase History
| Date | Buyer | Sale Price | Title Company |
|---|---|---|---|
| Young Tiffany M | -- | -- | |
| Young Andy C | $25,200 | -- | |
| Stearns Bank | $66,000 | -- | |
| Low Joseph C | -- | -- | |
| Low Joseph C | -- | -- | |
| Low N C | $30,000 | -- | |
| Low Jewell Bunch Etal | -- | -- |
Source: Public Records
Mortgage History
| Date | Status | Borrower | Loan Amount |
|---|---|---|---|
| Previous Owner | Young Andy C | $21,102 |
Source: Public Records
Tax History Compared to Growth
Tax History
| Year | Tax Paid | Tax Assessment Tax Assessment Total Assessment is a certain percentage of the fair market value that is determined by local assessors to be the total taxable value of land and additions on the property. | Land | Improvement |
|---|---|---|---|---|
| 2024 | $1,758 | $80,664 | $14,000 | $66,664 |
| 2023 | $1,802 | $80,664 | $14,000 | $66,664 |
| 2022 | $854 | $41,967 | $8,609 | $33,358 |
| 2021 | $914 | $41,967 | $8,609 | $33,358 |
| 2020 | $942 | $41,967 | $8,609 | $33,358 |
| 2019 | $964 | $41,967 | $8,609 | $33,358 |
| 2018 | $973 | $41,967 | $8,609 | $33,358 |
| 2017 | $988 | $41,967 | $8,609 | $33,358 |
| 2016 | $241 | $8,013 | $2,067 | $8,013 |
| 2015 | $981 | $41,967 | $8,609 | $33,358 |
| 2014 | -- | $41,967 | $8,609 | $33,358 |
| 2013 | -- | $41,967 | $8,608 | $33,358 |
Source: Public Records
Map
Nearby Homes
- LOT 147 Creek Crossing E
- 272 Highgrove Dr
- 271 Highgrove Dr
- Lot 148 Eddy Waters Cir
- Lot 246 Spear Point Dr
- 190 Old Blairsville Hwy
- Lot 5 Bravo Way
- 00 Antioch Church Rd
- 526 Antioch Church Rd
- Lot 44 Bucktail Way
- 1156 Old Talking Rock Hwy
- 0 Highway 136 W Unit 418131
- 0 Highway 136 W Unit 10586132
- 0 Highway 136 W Unit 7634085
- 4143 Talking Rock Rd
- Lot 104 Mountain Creek Hollow Dr
- 38 Ac Whitestone Rd
- 471 & 475 Sterling Rd
- 129 Old Blairsville Hwy
- 51 Talonah St
- 000 Talonah St
- 4525 Highway 136 W
- 4479 Highway 136 W
- 19 Talonah St
- 00 Talonah St
- 0 Talonah St
- 69 Old Blairsville Hwy
- 0 Georgia 136
- x Quail Way
- W Georgia 136 Unit 87 3
- W Georgia 136 Unit 87 5
- W Georgia 136 Unit 87 4
- Trt A Highway 136 Connector
- TractA Georgia 136
- W Georgia 136
- 146 Talonah St
- 4459 Highway 136 W
- 00 Georgia 136