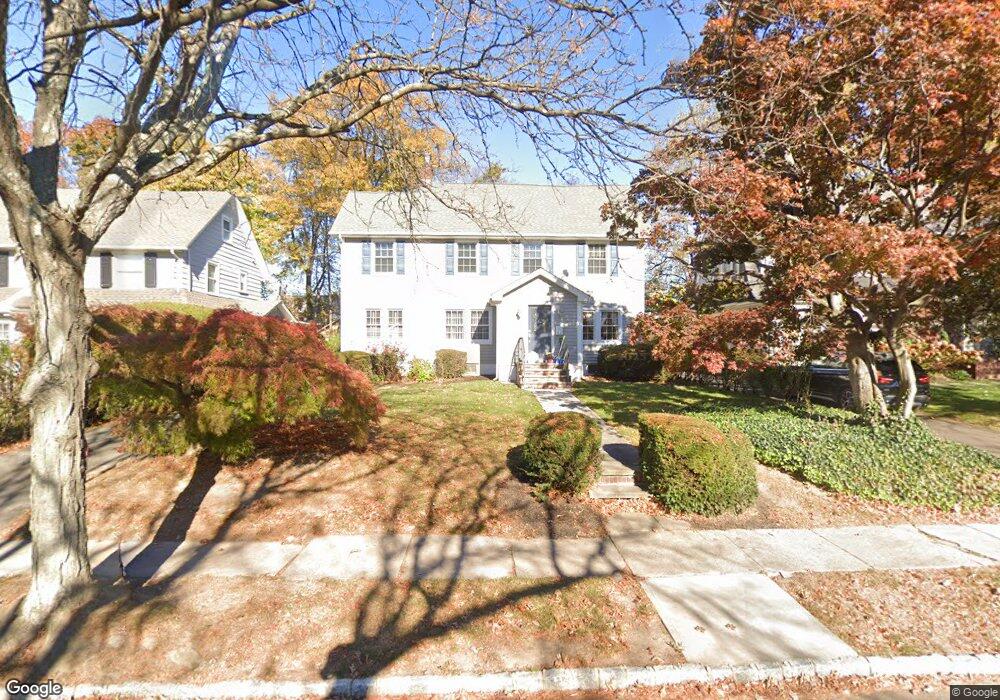
62 Tuxedo Rd Montclair, NJ 07042
Estimated Value: $1,336,410 - $1,732,000
--
Bed
--
Bath
3,144
Sq Ft
$517/Sq Ft
Est. Value
About This Home
This home is located at 62 Tuxedo Rd, Montclair, NJ 07042 and is currently estimated at $1,625,103, approximately $516 per square foot. 62 Tuxedo Rd is a home located in Essex County with nearby schools including Hillside School, Bradford School, and Charles H. Bullock School.
Ownership History
Date
Name
Owned For
Owner Type
Purchase Details
Closed on
Aug 31, 2001
Sold by
Zeigler Alison
Bought by
Roy Barry and Roy Angela Pandolfo
Current Estimated Value
Home Financials for this Owner
Home Financials are based on the most recent Mortgage that was taken out on this home.
Original Mortgage
$311,200
Outstanding Balance
$121,881
Interest Rate
7.05%
Estimated Equity
$1,503,222
Create a Home Valuation Report for This Property
The Home Valuation Report is an in-depth analysis detailing your home's value as well as a comparison with similar homes in the area
Home Values in the Area
Average Home Value in this Area
Purchase History
| Date | Buyer | Sale Price | Title Company |
|---|---|---|---|
| Roy Barry | $309,000 | -- | |
| -- | $389,000 | -- |
Source: Public Records
Mortgage History
| Date | Status | Borrower | Loan Amount |
|---|---|---|---|
| Open | -- | $311,200 |
Source: Public Records
Tax History Compared to Growth
Tax History
| Year | Tax Paid | Tax Assessment Tax Assessment Total Assessment is a certain percentage of the fair market value that is determined by local assessors to be the total taxable value of land and additions on the property. | Land | Improvement |
|---|---|---|---|---|
| 2025 | $24,397 | $721,800 | $348,000 | $373,800 |
| 2024 | $24,397 | $721,800 | $348,000 | $373,800 |
| 2022 | $23,733 | $721,800 | $348,000 | $373,800 |
| 2021 | $23,321 | $721,800 | $348,000 | $373,800 |
| 2020 | $22,946 | $721,800 | $348,000 | $373,800 |
| 2019 | $22,708 | $721,800 | $348,000 | $373,800 |
| 2018 | $22,332 | $721,800 | $348,000 | $373,800 |
| 2017 | $23,050 | $617,300 | $302,100 | $315,200 |
| 2016 | $19,366 | $532,900 | $302,100 | $230,800 |
| 2015 | $18,790 | $532,900 | $302,100 | $230,800 |
| 2014 | $18,161 | $532,900 | $302,100 | $230,800 |
Source: Public Records
Map
Nearby Homes
- 58 Cambridge Rd
- 69 Christopher St
- 37 Montclair Ave
- 41 Glenridge Ave Unit 2L
- 41 Glenridge Ave Unit 2R
- 411 Ridgewood Ave
- 197 N Fullerton Ave
- 63 Greenwood Ave
- 76 Grove St Unit 4
- 76 Grove St
- 81 N Fullerton Ave
- 48 N Willow St
- 183 Claremont Ave
- 101 Park St
- 734 Broad St
- 27 Grant St
- 715 Broad St
- 163 Park St