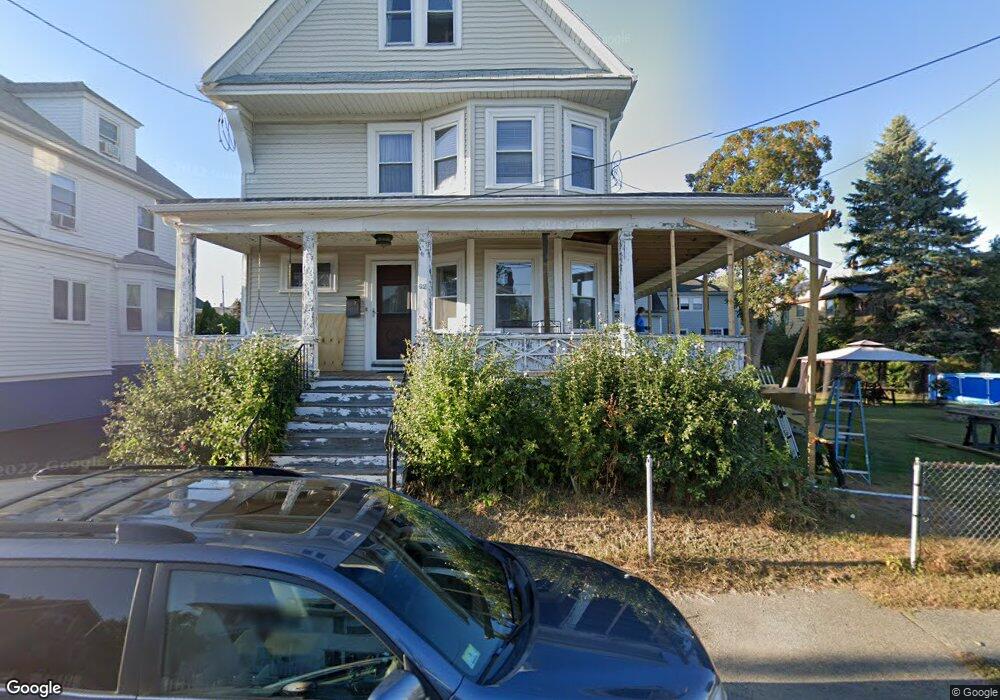
62 Webster St Quincy, MA 02171
North Quincy NeighborhoodEstimated Value: $797,000 - $849,613
4
Beds
2
Baths
1,602
Sq Ft
$514/Sq Ft
Est. Value
About This Home
This home is located at 62 Webster St, Quincy, MA 02171 and is currently estimated at $822,653, approximately $513 per square foot. 62 Webster St is a home located in Norfolk County with nearby schools including Francis W. Parker Elementary School, Atlantic Middle School, and North Quincy High School.
Ownership History
Date
Name
Owned For
Owner Type
Purchase Details
Closed on
Sep 30, 2008
Sold by
Everson Eleanor F and Everson Leighton R
Bought by
Bokulich Alisa N and Bokulich Peter J
Current Estimated Value
Home Financials for this Owner
Home Financials are based on the most recent Mortgage that was taken out on this home.
Original Mortgage
$75,000
Outstanding Balance
$49,390
Interest Rate
6.57%
Mortgage Type
Purchase Money Mortgage
Estimated Equity
$773,263
Create a Home Valuation Report for This Property
The Home Valuation Report is an in-depth analysis detailing your home's value as well as a comparison with similar homes in the area
Home Values in the Area
Average Home Value in this Area
Purchase History
| Date | Buyer | Sale Price | Title Company |
|---|---|---|---|
| Bokulich Alisa N | -- | -- | |
| Bokulich Alisa N | $370,000 | -- |
Source: Public Records
Mortgage History
| Date | Status | Borrower | Loan Amount |
|---|---|---|---|
| Open | Bokulich Alisa N | $75,000 | |
| Open | Bokulich Alisa N | $296,000 |
Source: Public Records
Tax History
| Year | Tax Paid | Tax Assessment Tax Assessment Total Assessment is a certain percentage of the fair market value that is determined by local assessors to be the total taxable value of land and additions on the property. | Land | Improvement |
|---|---|---|---|---|
| 2025 | $8,890 | $771,000 | $428,900 | $342,100 |
| 2024 | $8,545 | $758,200 | $428,900 | $329,300 |
| 2023 | $7,824 | $703,000 | $390,700 | $312,300 |
| 2022 | $7,522 | $627,900 | $314,300 | $313,600 |
| 2021 | $7,201 | $593,200 | $314,300 | $278,900 |
| 2020 | $7,063 | $568,200 | $308,300 | $259,900 |
| 2019 | $6,935 | $552,600 | $296,800 | $255,800 |
| 2018 | $6,865 | $514,600 | $283,100 | $231,500 |
| 2017 | $6,704 | $473,100 | $258,100 | $215,000 |
| 2016 | $6,252 | $435,400 | $235,400 | $200,000 |
| 2015 | $5,818 | $398,500 | $214,700 | $183,800 |
| 2014 | $5,577 | $375,300 | $214,700 | $160,600 |
Source: Public Records
Map
Nearby Homes
- 297 Billings St
- 201 Billings St
- 27 Herbert Rd
- 28 Apthorp St
- 175 Quincy Shore Dr Unit B24
- 175 Quincy Shore Dr Unit B23
- 212 Quincy Shore Dr
- 85 E Squantum St Unit 10
- 138 Quincy Shore Dr Unit 170
- 90 Quincy Shore Dr Unit 721
- 90 Quincy Shore Dr Unit 501
- 133 Commander Shea Blvd Unit 502
- 133 Commander Shea Blvd Unit 709
- 17 Holmes St Unit 204
- 17 Holmes St Unit 2
- 17 Holmes St Unit 1
- 865 E Squantum St
- 11 Cleaves St
- 100 Marina Dr Unit 615
- 100 Marina Dr Unit 306
- 58 Webster St
- 273 Billings St
- 279 Billings St
- 283 Billings St
- 61 Webster St
- 287 Billings St
- 287 Billings St Unit A
- 57 Webster St
- 65 Webster St
- 50 Webster St Unit single
- 50 Webster St Unit 1
- 74 Webster St
- 74 Webster St Unit 2
- 74 Webster St Unit 1
- 48 Webster St
- 267 Billings St
- 49 Webster St
- 291 Billings St
- 71 Webster St
- 69 Webster St
Your Personal Tour Guide
Ask me questions while you tour the home.