62 Wenham Rd Carver, MA 02330
Estimated Value: $411,960 - $513,000
1
Bed
1
Bath
612
Sq Ft
$739/Sq Ft
Est. Value
About This Home
This home is located at 62 Wenham Rd, Carver, MA 02330 and is currently estimated at $451,990, approximately $738 per square foot. 62 Wenham Rd is a home with nearby schools including Carver Elementary School and Map Academy Charter School.
Ownership History
Date
Name
Owned For
Owner Type
Purchase Details
Closed on
Aug 17, 1993
Sold by
Msa Mfg Co Inc Emp Pen and Surprenant Conrad
Bought by
Bartlett Dean A and Bartlett Claire U
Current Estimated Value
Home Financials for this Owner
Home Financials are based on the most recent Mortgage that was taken out on this home.
Original Mortgage
$80,000
Interest Rate
7.16%
Mortgage Type
Purchase Money Mortgage
Purchase Details
Closed on
Jun 8, 1993
Sold by
Hacking Catherine C
Bought by
Msa Mfg Co Inc
Purchase Details
Closed on
Oct 14, 1988
Sold by
Anctil Ronald J
Bought by
Hacking Catherine C
Home Financials for this Owner
Home Financials are based on the most recent Mortgage that was taken out on this home.
Original Mortgage
$90,000
Interest Rate
10.63%
Mortgage Type
Purchase Money Mortgage
Purchase Details
Closed on
Jun 1, 1987
Sold by
Felaccio James M
Bought by
Anctil Ronald J
Home Financials for this Owner
Home Financials are based on the most recent Mortgage that was taken out on this home.
Original Mortgage
$50,000
Interest Rate
10.25%
Mortgage Type
Purchase Money Mortgage
Create a Home Valuation Report for This Property
The Home Valuation Report is an in-depth analysis detailing your home's value as well as a comparison with similar homes in the area
Home Values in the Area
Average Home Value in this Area
Purchase History
| Date | Buyer | Sale Price | Title Company |
|---|---|---|---|
| Bartlett Dean A | $105,000 | -- | |
| Msa Mfg Co Inc | $75,500 | -- | |
| Hacking Catherine C | $189,900 | -- | |
| Anctil Ronald J | $132,900 | -- |
Source: Public Records
Mortgage History
| Date | Status | Borrower | Loan Amount |
|---|---|---|---|
| Closed | Anctil Ronald J | $80,000 | |
| Previous Owner | Anctil Ronald J | $90,000 | |
| Previous Owner | Anctil Ronald J | $50,000 |
Source: Public Records
Tax History Compared to Growth
Tax History
| Year | Tax Paid | Tax Assessment Tax Assessment Total Assessment is a certain percentage of the fair market value that is determined by local assessors to be the total taxable value of land and additions on the property. | Land | Improvement |
|---|---|---|---|---|
| 2025 | $5,294 | $381,700 | $157,200 | $224,500 |
| 2024 | $5,120 | $361,300 | $154,100 | $207,200 |
| 2023 | $5,060 | $346,800 | $154,100 | $192,700 |
| 2022 | $4,813 | $301,200 | $131,800 | $169,400 |
| 2021 | $4,655 | $274,800 | $117,700 | $157,100 |
| 2020 | $4,500 | $261,800 | $110,000 | $151,800 |
| 2019 | $4,355 | $255,400 | $106,800 | $148,600 |
| 2018 | $4,444 | $245,100 | $106,800 | $138,300 |
| 2017 | $4,198 | $237,300 | $102,700 | $134,600 |
| 2016 | $3,878 | $227,700 | $97,800 | $129,900 |
| 2015 | $3,834 | $225,400 | $97,800 | $127,600 |
| 2014 | $4,057 | $238,500 | $123,700 | $114,800 |
Source: Public Records
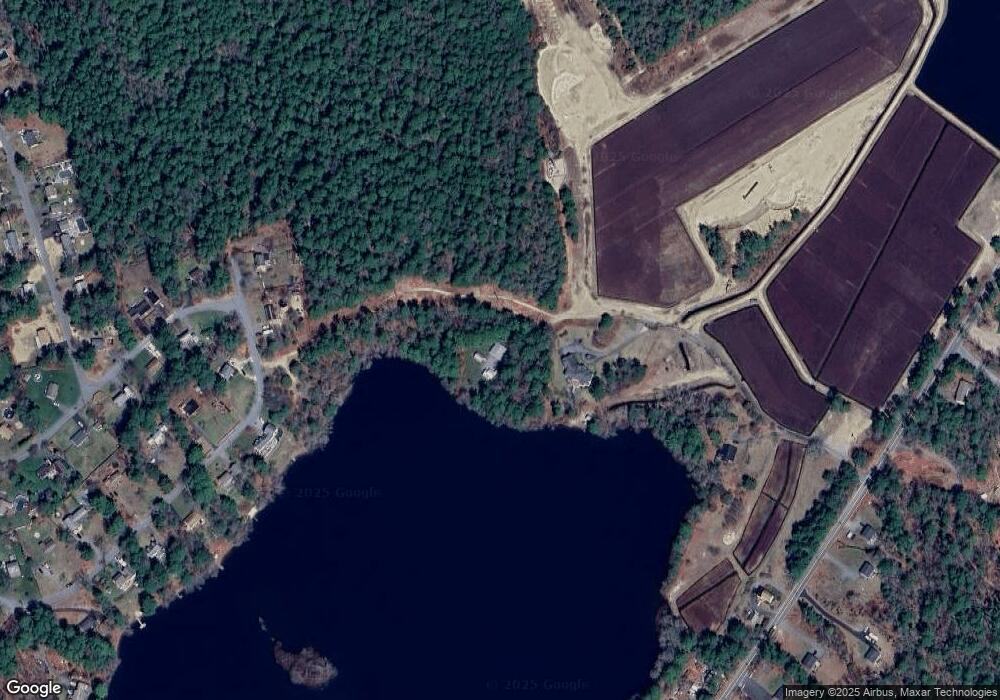
Map
Nearby Homes
- 10 Cranberry Cir
- 14 Cranberry Cir
- 1 Firlotte Dr
- 14 Cranberry Cr
- 11 Cranberry Cir
- 60 Wenham Rd
- 16 Cranberry Cir
- 5 Cranberry Cir
- 15 Cranberry Cir
- 6 Cranberry Cir
- 5 Cranberry Cir
- 5 Cranberry Cir
- 18 Cranberry Cir
- 3 Cranberry Cir
- 17 Cranberry Cir
- 4 Cranberry Cir
- 1 Cranberry Cir
- 20 Cranberry Cir
- 58 Wenham Rd
- 2 Cranberry Cir