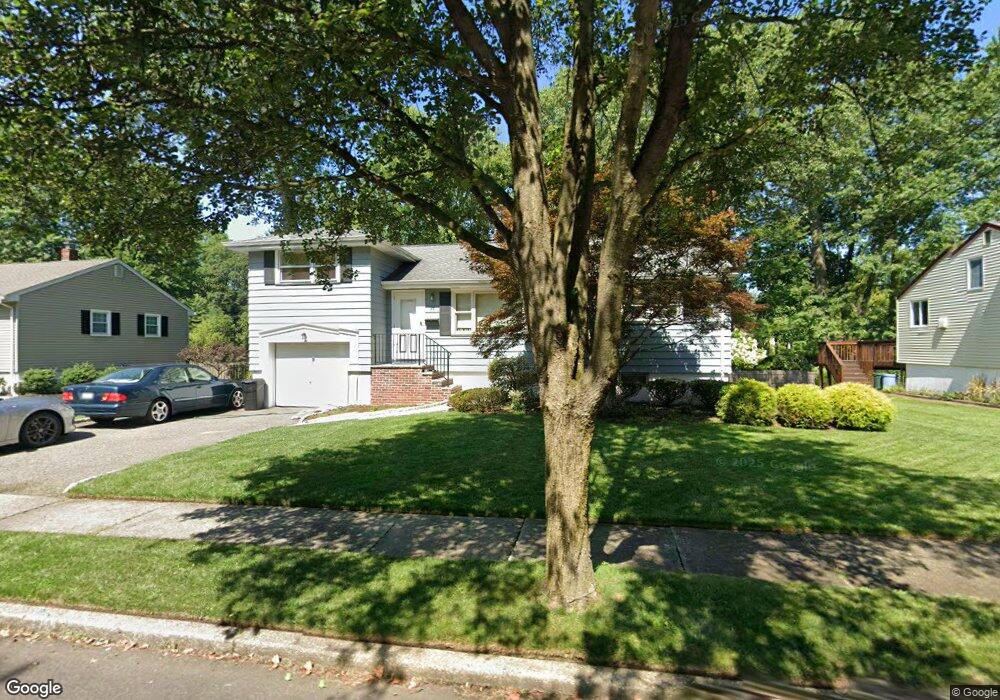
62 Whalen Ct Westwood, NJ 07675
Estimated Value: $670,000 - $734,131
--
Bed
--
Bath
1,340
Sq Ft
$525/Sq Ft
Est. Value
About This Home
This home is located at 62 Whalen Ct, Westwood, NJ 07675 and is currently estimated at $703,283, approximately $524 per square foot. 62 Whalen Ct is a home located in Bergen County with nearby schools including Westwood Regional High School, Primoris Academy, and Bergen Catholic High School.
Ownership History
Date
Name
Owned For
Owner Type
Purchase Details
Closed on
Jun 10, 2020
Sold by
Savas Christina
Bought by
Savas Christina
Current Estimated Value
Purchase Details
Closed on
Oct 17, 2000
Bought by
Savas Savas J
Home Financials for this Owner
Home Financials are based on the most recent Mortgage that was taken out on this home.
Original Mortgage
$180,000
Outstanding Balance
$65,503
Interest Rate
7.89%
Estimated Equity
$637,780
Create a Home Valuation Report for This Property
The Home Valuation Report is an in-depth analysis detailing your home's value as well as a comparison with similar homes in the area
Home Values in the Area
Average Home Value in this Area
Purchase History
| Date | Buyer | Sale Price | Title Company |
|---|---|---|---|
| Savas Christina | -- | None Available | |
| Savas Savas J | -- | -- | |
| Savas Savas J | -- | -- |
Source: Public Records
Mortgage History
| Date | Status | Borrower | Loan Amount |
|---|---|---|---|
| Open | Savas Savas J | $180,000 | |
| Closed | Savas Savas J | $180,000 |
Source: Public Records
Tax History Compared to Growth
Tax History
| Year | Tax Paid | Tax Assessment Tax Assessment Total Assessment is a certain percentage of the fair market value that is determined by local assessors to be the total taxable value of land and additions on the property. | Land | Improvement |
|---|---|---|---|---|
| 2025 | $11,842 | $574,300 | $367,500 | $206,800 |
| 2024 | $11,777 | $542,200 | $345,000 | $197,200 |
| 2023 | $11,614 | $513,600 | $323,800 | $189,800 |
| 2022 | $11,864 | $492,700 | $312,500 | $180,200 |
| 2021 | $11,665 | $474,900 | $300,000 | $174,900 |
| 2020 | $11,867 | $468,300 | $295,500 | $172,800 |
| 2019 | $11,658 | $462,600 | $293,000 | $169,600 |
| 2018 | $11,310 | $455,500 | $289,000 | $166,500 |
| 2017 | $11,311 | $450,800 | $285,000 | $165,800 |
| 2016 | $11,089 | $422,100 | $275,000 | $147,100 |
| 2015 | $10,488 | $422,100 | $275,000 | $147,100 |
| 2014 | $10,269 | $422,100 | $275,000 | $147,100 |
Source: Public Records
Map
Nearby Homes