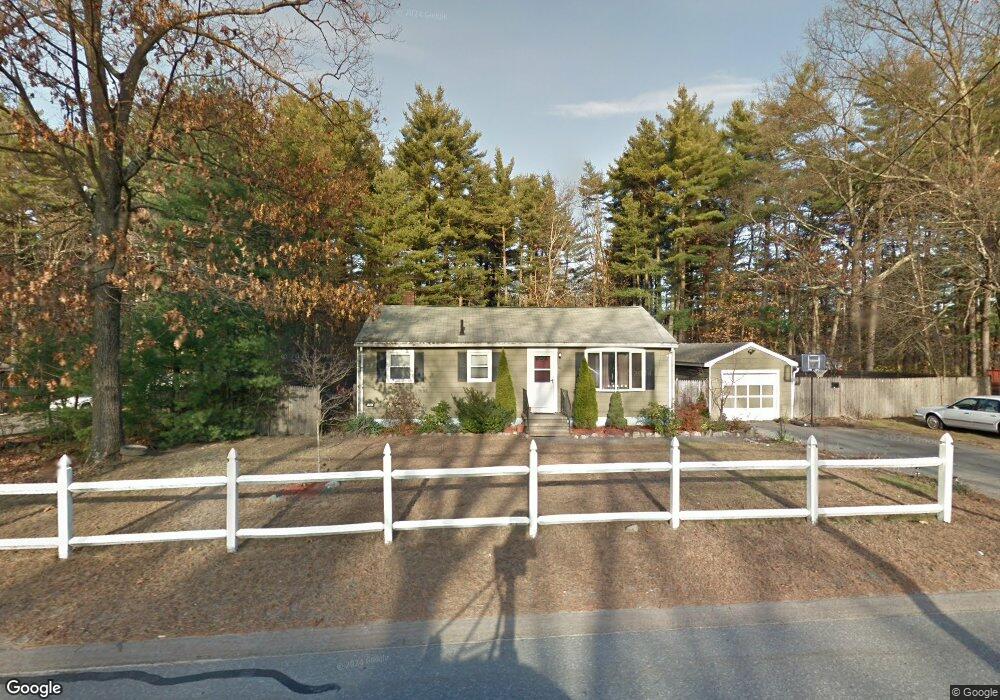
62 Whipple Rd Billerica, MA 01821
Estimated Value: $486,000 - $612,000
3
Beds
1
Bath
960
Sq Ft
$575/Sq Ft
Est. Value
About This Home
This home is located at 62 Whipple Rd, Billerica, MA 01821 and is currently estimated at $552,207, approximately $575 per square foot. 62 Whipple Rd is a home located in Middlesex County with nearby schools including Billerica Memorial High School.
Ownership History
Date
Name
Owned For
Owner Type
Purchase Details
Closed on
Apr 11, 2002
Sold by
Walthall John and Walthall Claire
Bought by
Ferranti Ronald
Current Estimated Value
Home Financials for this Owner
Home Financials are based on the most recent Mortgage that was taken out on this home.
Original Mortgage
$105,000
Interest Rate
6.84%
Mortgage Type
Purchase Money Mortgage
Purchase Details
Closed on
Mar 31, 2000
Sold by
Cullinan Paul G and Cullinan Donna M
Bought by
Walthall John and Walthall Claire
Home Financials for this Owner
Home Financials are based on the most recent Mortgage that was taken out on this home.
Original Mortgage
$163,450
Interest Rate
8.4%
Mortgage Type
Purchase Money Mortgage
Purchase Details
Closed on
Dec 13, 1994
Sold by
Dipietro Joseph and Dipietro Karen
Bought by
Cullinan Paul G and Cullinan Donna
Purchase Details
Closed on
Mar 24, 1987
Sold by
Crowell Harold G
Bought by
Dipietro Joseph C
Create a Home Valuation Report for This Property
The Home Valuation Report is an in-depth analysis detailing your home's value as well as a comparison with similar homes in the area
Home Values in the Area
Average Home Value in this Area
Purchase History
| Date | Buyer | Sale Price | Title Company |
|---|---|---|---|
| Ferranti Ronald | $245,000 | -- | |
| Walthall John | $169,900 | -- | |
| Cullinan Paul G | $133,000 | -- | |
| Dipietro Joseph C | $134,000 | -- |
Source: Public Records
Mortgage History
| Date | Status | Borrower | Loan Amount |
|---|---|---|---|
| Open | Dipietro Joseph C | $162,500 | |
| Closed | Dipietro Joseph C | $105,000 | |
| Previous Owner | Dipietro Joseph C | $163,450 |
Source: Public Records
Tax History Compared to Growth
Tax History
| Year | Tax Paid | Tax Assessment Tax Assessment Total Assessment is a certain percentage of the fair market value that is determined by local assessors to be the total taxable value of land and additions on the property. | Land | Improvement |
|---|---|---|---|---|
| 2025 | $5,343 | $469,900 | $292,900 | $177,000 |
| 2024 | $4,881 | $432,300 | $264,500 | $167,800 |
| 2023 | $4,704 | $396,300 | $230,800 | $165,500 |
| 2022 | $4,357 | $344,700 | $202,400 | $142,300 |
| 2021 | $7,899 | $320,600 | $184,600 | $136,000 |
| 2020 | $4,072 | $313,500 | $177,500 | $136,000 |
| 2019 | $3,936 | $292,000 | $166,900 | $125,100 |
| 2018 | $6,184 | $264,400 | $150,900 | $113,500 |
| 2017 | $3,518 | $249,700 | $145,600 | $104,100 |
| 2016 | $3,466 | $245,100 | $141,000 | $104,100 |
| 2015 | $3,330 | $237,200 | $133,100 | $104,100 |
| 2014 | $3,370 | $235,800 | $131,700 | $104,100 |
Source: Public Records
Map
Nearby Homes