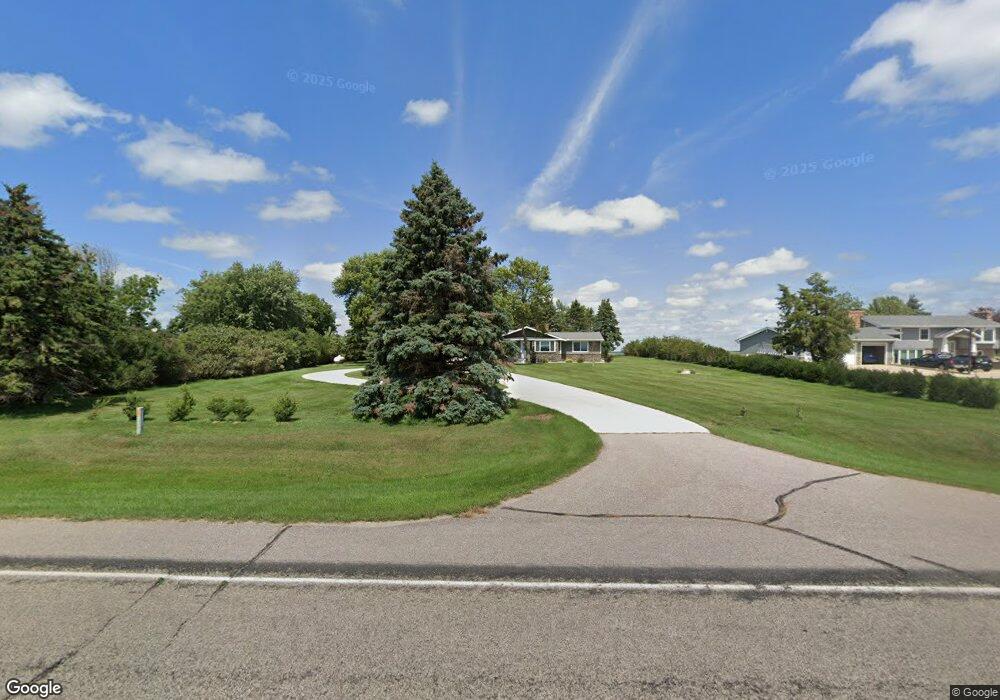
620 111th St Pipestone, MN 56164
Estimated Value: $332,946 - $350,000
Studio
--
Bath
--
Sq Ft
59,677
Sq Ft Lot
About This Home
This home is located at 620 111th St, Pipestone, MN 56164 and is currently estimated at $341,473. 620 111th St is a home located in Pipestone County with nearby schools including Pipestone Elementary School, Brown Elementary School, and Pipestone Head Start.
Ownership History
Date
Name
Owned For
Owner Type
Purchase Details
Closed on
Apr 30, 2010
Sold by
Betty H Manderscheid Trust Dated Ma Russell M and Betty H Manderscheid Trust Dat Richard Mander
Bought by
Odland Isaac and Odland Carissa
Current Estimated Value
Home Financials for this Owner
Home Financials are based on the most recent Mortgage that was taken out on this home.
Original Mortgage
$116,000
Outstanding Balance
$78,168
Interest Rate
5.16%
Estimated Equity
$263,305
Create a Home Valuation Report for This Property
The Home Valuation Report is an in-depth analysis detailing your home's value as well as a comparison with similar homes in the area
Home Values in the Area
Average Home Value in this Area
Purchase History
| Date | Buyer | Sale Price | Title Company |
|---|---|---|---|
| Odland Isaac | -- | -- |
Source: Public Records
Mortgage History
| Date | Status | Borrower | Loan Amount |
|---|---|---|---|
| Open | Odland Isaac | $116,000 |
Source: Public Records
Tax History
| Year | Tax Paid | Tax Assessment Tax Assessment Total Assessment is a certain percentage of the fair market value that is determined by local assessors to be the total taxable value of land and additions on the property. | Land | Improvement |
|---|---|---|---|---|
| 2025 | $2,266 | $345,800 | $35,900 | $309,900 |
| 2024 | $2,266 | $363,800 | $53,900 | $309,900 |
| 2023 | $2,066 | $332,200 | $37,200 | $295,000 |
| 2022 | $2,538 | $297,600 | $37,200 | $260,400 |
| 2021 | $2,602 | $244,800 | $37,200 | $207,600 |
| 2020 | $2,542 | $244,800 | $37,200 | $207,600 |
| 2019 | $2,338 | $238,100 | $34,000 | $204,100 |
| 2018 | $2,026 | $216,700 | $33,800 | $182,900 |
| 2017 | $2,108 | $182,200 | $33,800 | $148,400 |
| 2016 | $1,782 | $0 | $0 | $0 |
| 2015 | $950 | $107,900 | $24,869 | $83,031 |
| 2014 | $950 | $107,600 | $24,532 | $83,068 |
Source: Public Records
Map
Nearby Homes
Your Personal Tour Guide
Ask me questions while you tour the home.