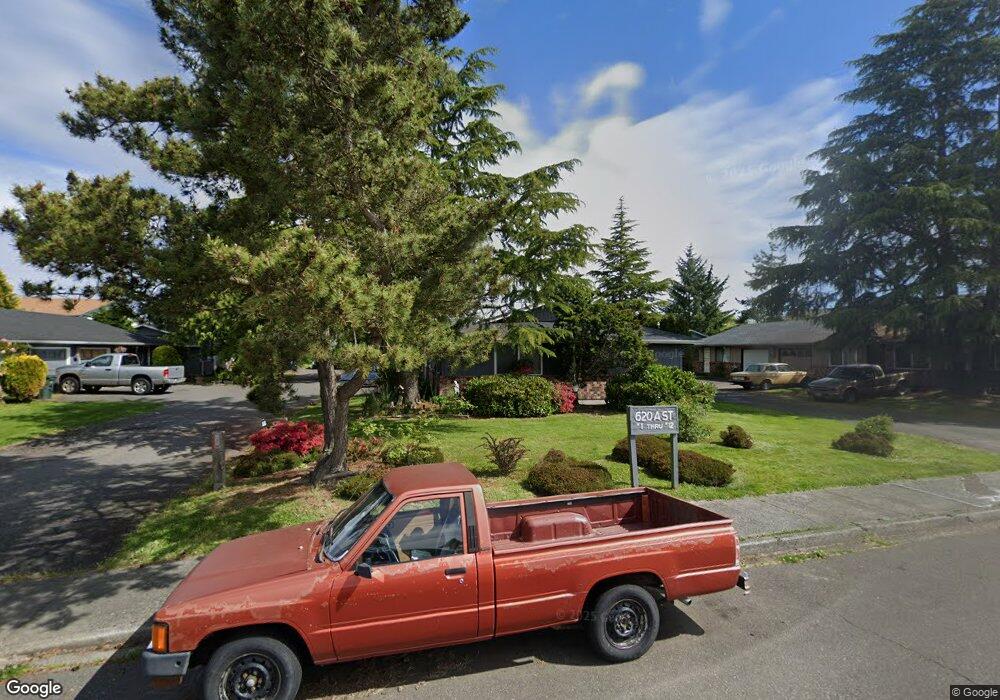
620 A St Unit 11 Blaine, WA 98230
Estimated Value: $449,000 - $606,000
4
Beds
2
Baths
1,728
Sq Ft
$306/Sq Ft
Est. Value
About This Home
This home is located at 620 A St Unit 11, Blaine, WA 98230 and is currently estimated at $528,530, approximately $305 per square foot. 620 A St Unit 11 is a home located in Whatcom County with nearby schools including Blaine Primary School, Blaine Elementary School, and Blaine Middle School.
Ownership History
Date
Name
Owned For
Owner Type
Purchase Details
Closed on
Nov 23, 2015
Sold by
Chang Chih Kuei
Bought by
Shafeel Mohammed and Shafeel Aliza
Current Estimated Value
Home Financials for this Owner
Home Financials are based on the most recent Mortgage that was taken out on this home.
Original Mortgage
$166,250
Outstanding Balance
$130,630
Interest Rate
3.76%
Mortgage Type
New Conventional
Estimated Equity
$397,900
Purchase Details
Closed on
Dec 5, 2012
Sold by
Chang Chun Lien
Bought by
Chang Chih Kuei
Create a Home Valuation Report for This Property
The Home Valuation Report is an in-depth analysis detailing your home's value as well as a comparison with similar homes in the area
Home Values in the Area
Average Home Value in this Area
Purchase History
| Date | Buyer | Sale Price | Title Company |
|---|---|---|---|
| Shafeel Mohammed | $175,000 | Whatcom Land Title | |
| Chang Chih Kuei | $50,280 | Whatcom Land Title |
Source: Public Records
Mortgage History
| Date | Status | Borrower | Loan Amount |
|---|---|---|---|
| Open | Shafeel Mohammed | $166,250 |
Source: Public Records
Tax History Compared to Growth
Tax History
| Year | Tax Paid | Tax Assessment Tax Assessment Total Assessment is a certain percentage of the fair market value that is determined by local assessors to be the total taxable value of land and additions on the property. | Land | Improvement |
|---|---|---|---|---|
| 2024 | $3,009 | $446,806 | $155,400 | $291,406 |
| 2023 | $3,009 | $446,806 | $155,400 | $291,406 |
| 2022 | $2,602 | $402,528 | $140,000 | $262,528 |
| 2021 | $2,482 | $298,182 | $115,598 | $182,584 |
| 2020 | $2,362 | $259,288 | $100,520 | $158,768 |
| 2019 | $2,199 | $237,440 | $92,050 | $145,390 |
| 2018 | $2,044 | $215,773 | $83,650 | $132,123 |
| 2017 | $1,822 | $180,563 | $70,000 | $110,563 |
| 2016 | $1,561 | $180,563 | $70,000 | $110,563 |
| 2015 | $1,529 | $149,186 | $40,148 | $109,038 |
| 2014 | -- | $142,767 | $38,420 | $104,347 |
| 2013 | -- | $141,210 | $38,000 | $103,210 |
Source: Public Records
Map
Nearby Homes