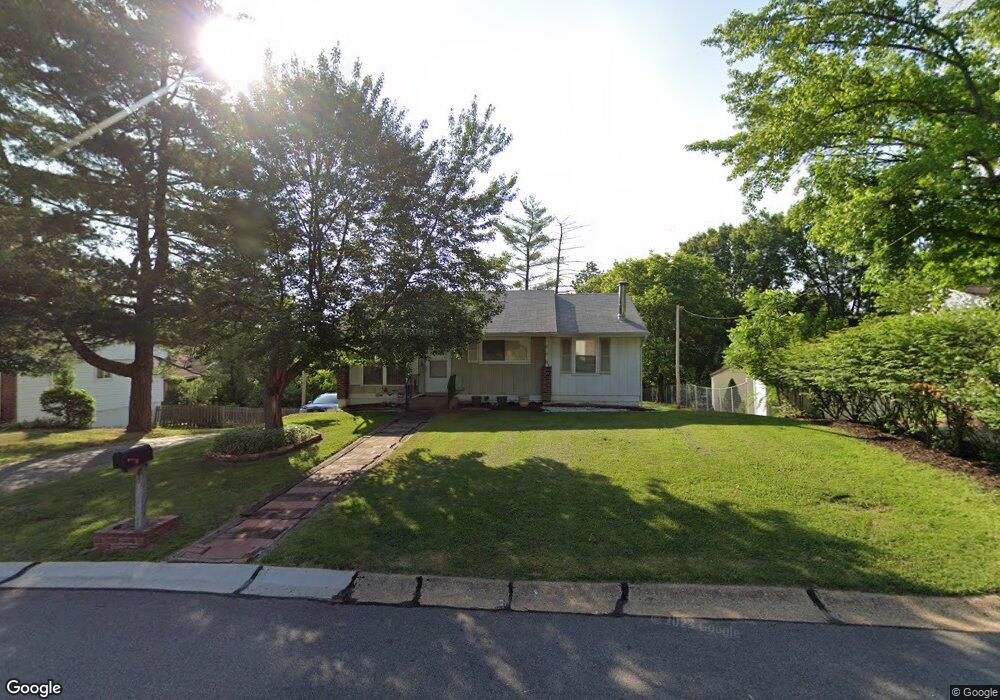
620 Auber Dr Ballwin, MO 63011
Estimated Value: $265,000 - $299,000
3
Beds
2
Baths
925
Sq Ft
$296/Sq Ft
Est. Value
About This Home
This home is located at 620 Auber Dr, Ballwin, MO 63011 and is currently estimated at $273,812, approximately $296 per square foot. 620 Auber Dr is a home located in St. Louis County with nearby schools including Pierremont Elementary School, Parkway West Middle School, and Parkway West High School.
Ownership History
Date
Name
Owned For
Owner Type
Purchase Details
Closed on
Dec 30, 2002
Sold by
Morgan Christian and Morgan Dawn M
Bought by
Hagaman Fang Ming
Current Estimated Value
Home Financials for this Owner
Home Financials are based on the most recent Mortgage that was taken out on this home.
Original Mortgage
$109,600
Interest Rate
6.06%
Mortgage Type
Balloon
Purchase Details
Closed on
May 29, 2001
Sold by
Murray Ganninger Frank and Lynn Vicki
Bought by
Morgan Christian and Morgan Dawn
Home Financials for this Owner
Home Financials are based on the most recent Mortgage that was taken out on this home.
Original Mortgage
$108,000
Interest Rate
7.1%
Purchase Details
Closed on
Jan 29, 1998
Sold by
Jones Andrew K and Whaley Lynnann Whaley
Bought by
Ganninger Frank Murray and Ganninger Vicki Lynn
Home Financials for this Owner
Home Financials are based on the most recent Mortgage that was taken out on this home.
Original Mortgage
$83,040
Interest Rate
12%
Create a Home Valuation Report for This Property
The Home Valuation Report is an in-depth analysis detailing your home's value as well as a comparison with similar homes in the area
Home Values in the Area
Average Home Value in this Area
Purchase History
| Date | Buyer | Sale Price | Title Company |
|---|---|---|---|
| Hagaman Fang Ming | $137,000 | -- | |
| Morgan Christian | $128,000 | -- | |
| Morgan Christian | -- | -- | |
| Ganninger Frank Murray | -- | -- |
Source: Public Records
Mortgage History
| Date | Status | Borrower | Loan Amount |
|---|---|---|---|
| Closed | Hagaman Fang Ming | $109,600 | |
| Previous Owner | Morgan Christian | $108,000 | |
| Previous Owner | Ganninger Frank Murray | $83,040 |
Source: Public Records
Tax History
| Year | Tax Paid | Tax Assessment Tax Assessment Total Assessment is a certain percentage of the fair market value that is determined by local assessors to be the total taxable value of land and additions on the property. | Land | Improvement |
|---|---|---|---|---|
| 2025 | $2,845 | $50,630 | $28,040 | $22,590 |
| 2024 | $2,845 | $41,310 | $20,010 | $21,300 |
| 2023 | $2,869 | $41,310 | $20,010 | $21,300 |
| 2022 | $2,780 | $36,790 | $24,040 | $12,750 |
| 2021 | $2,765 | $36,790 | $24,040 | $12,750 |
| 2020 | $2,486 | $31,610 | $19,530 | $12,080 |
| 2019 | $2,436 | $31,610 | $19,530 | $12,080 |
| 2018 | $2,143 | $25,760 | $14,740 | $11,020 |
| 2016 | $2,018 | $23,520 | $11,800 | $11,720 |
Source: Public Records
Map
Nearby Homes
- 609 Auber Dr
- 1041 Kennedy Ln
- 709 Turtle Cove
- 1061 Summer Tree Dr
- 902 Rusticmanor Cir
- 0 Unknown Unit MIS25060078
- 0 Unknown Unit MIS25060104
- 0 Unknown Unit MIS25060076
- 0 Unknown Unit MIS25060105
- 0 Unknown Unit MIS25060100
- 0 Unknown Unit MIS25060079
- 0 Unknown Unit MIS25060108
- 0 Unknown Unit MIS25060103
- 0 Unknown Unit MIS25060077
- 1022 Julianna Dr
- 1042 Parkwatch Dr
- 828 Windmill Dr
- 221 Braeshire Dr Unit B
- 221 Braeshire Dr Unit A
- 9 Lochhaven Ln
Your Personal Tour Guide
Ask me questions while you tour the home.