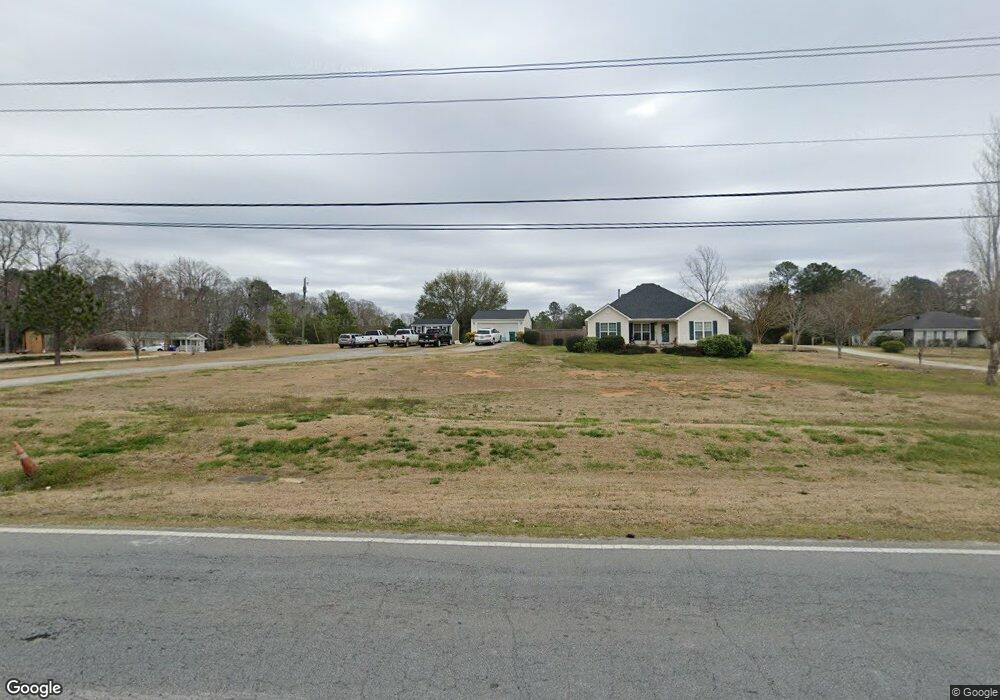
620 Chamblin Rd Grovetown, GA 30813
Estimated Value: $305,079 - $427,000
5
Beds
2
Baths
1,800
Sq Ft
$194/Sq Ft
Est. Value
About This Home
This home is located at 620 Chamblin Rd, Grovetown, GA 30813 and is currently estimated at $349,270, approximately $194 per square foot. 620 Chamblin Rd is a home located in Columbia County with nearby schools including Cedar Ridge Elementary School, Grovetown Middle School, and Grovetown High School.
Ownership History
Date
Name
Owned For
Owner Type
Purchase Details
Closed on
Oct 13, 2005
Sold by
W R Price Associates Inc
Bought by
Rook Cary E and Rook Olga Renee
Current Estimated Value
Home Financials for this Owner
Home Financials are based on the most recent Mortgage that was taken out on this home.
Original Mortgage
$40,500
Interest Rate
5.71%
Mortgage Type
New Conventional
Purchase Details
Closed on
Jul 31, 2003
Sold by
W R Price Associates Inc
Bought by
Rook Cary E
Home Financials for this Owner
Home Financials are based on the most recent Mortgage that was taken out on this home.
Original Mortgage
$131,580
Interest Rate
5.72%
Mortgage Type
VA
Purchase Details
Closed on
Apr 4, 2002
Sold by
Price Wendell R and Price Katherine G
Bought by
W R Price Associates Inc
Home Financials for this Owner
Home Financials are based on the most recent Mortgage that was taken out on this home.
Original Mortgage
$65,000
Interest Rate
7.12%
Create a Home Valuation Report for This Property
The Home Valuation Report is an in-depth analysis detailing your home's value as well as a comparison with similar homes in the area
Home Values in the Area
Average Home Value in this Area
Purchase History
| Date | Buyer | Sale Price | Title Company |
|---|---|---|---|
| Rook Cary E | $45,000 | -- | |
| Rook Cary E | $129,000 | -- | |
| W R Price Associates Inc | $65,000 | -- |
Source: Public Records
Mortgage History
| Date | Status | Borrower | Loan Amount |
|---|---|---|---|
| Closed | Rook Cary E | $40,500 | |
| Previous Owner | Rook Cary E | $131,580 | |
| Previous Owner | W R Price Associates Inc | $65,000 |
Source: Public Records
Tax History
| Year | Tax Paid | Tax Assessment Tax Assessment Total Assessment is a certain percentage of the fair market value that is determined by local assessors to be the total taxable value of land and additions on the property. | Land | Improvement |
|---|---|---|---|---|
| 2025 | $3,226 | $137,319 | $19,196 | $118,123 |
| 2024 | $3,192 | $129,780 | $19,196 | $110,584 |
| 2023 | $3,192 | $125,853 | $15,612 | $110,241 |
| 2022 | $3,013 | $117,960 | $11,839 | $106,121 |
| 2021 | $2,809 | $105,340 | $11,462 | $93,878 |
| 2020 | $2,860 | $104,996 | $11,462 | $93,534 |
| 2019 | $2,760 | $101,390 | $11,462 | $89,928 |
| 2018 | $2,568 | $94,172 | $11,462 | $82,710 |
| 2017 | $2,527 | $92,362 | $11,462 | $80,900 |
| 2016 | $2,376 | $90,199 | $9,007 | $81,192 |
| 2015 | $2,270 | $86,095 | $9,007 | $77,088 |
| 2014 | $2,250 | $84,313 | $9,007 | $75,306 |
Source: Public Records
Map
Nearby Homes
- 656 Chamblin Rd
- 234 Havelock Dr
- 741 Old Indian Camp Rd
- 10 Milton Hitt Rd
- 1921 Kenlock Dr
- 410 Ripsaw Ct
- 1930 Kenlock Dr
- 207 Dripping Rock Pass
- 1650 Cedar Hill Dr
- 139 Broadleaf Trail
- 5114 Heathbrook Dr
- 712 Kensey Park Ln
- 1912 Butternut Dr Unit 12B
- 1965 Kenlock Dr
- 704 Red Cedar Ct
- 712 Red Cedar Ct
- 734 Kensey Park Ln
- 5355 Canterbury Farms Pkwy
- 695 Red Cedar Ct
- 1214 Absolon Ct
- 622 Chamblin Rd
- 1925 Cornelia Dr
- 600 Chamblin Rd Unit C
- 624 Chamblin Rd
- 600 Chamblin Rd Unit C
- 600 Chamblin Rd Unit A
- 600 Chamblin Rd
- 2014 Elmstead Ln
- 626 Chamblin Rd
- 610 Chamblin Rd
- 2010 Elmstead Ln
- 630 Chamblin Rd
- 2006 Elmstead Ln
- 2002 Elmstead Ln
- 00 Chamblin Rd
- 636 Dobhill Ln
- 724 Tarvin Cir
- 663 Dobhill Ln
- 663 Dobhill Ln Unit 663
- 159 Caroleton Dr
Your Personal Tour Guide
Ask me questions while you tour the home.