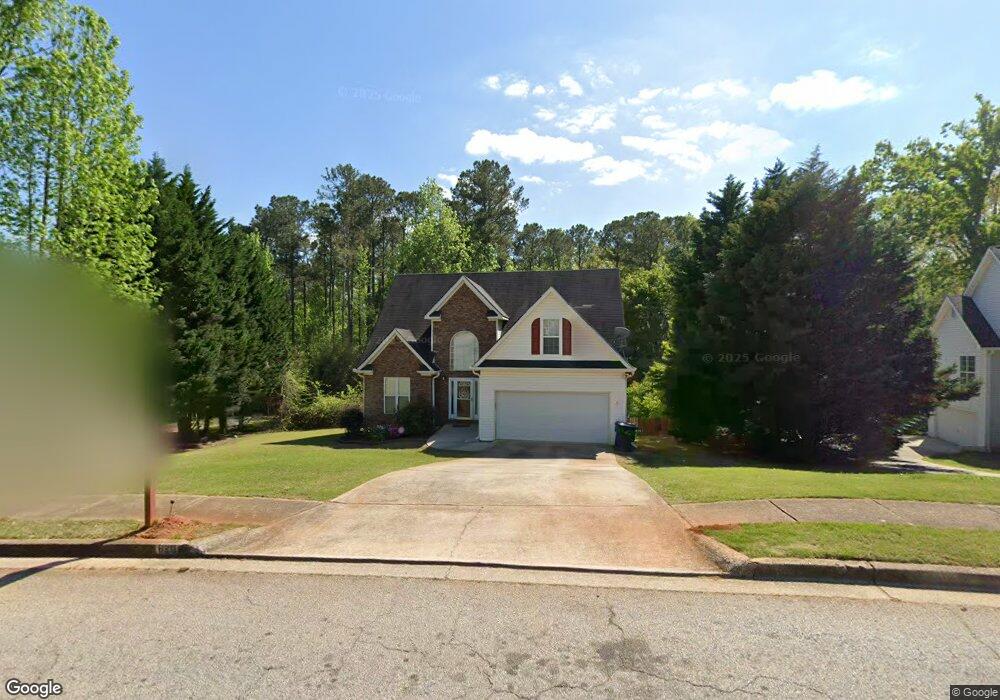
620 Chaseridge Dr Unit III McDonough, GA 30253
Estimated Value: $326,000 - $358,000
4
Beds
3
Baths
2,099
Sq Ft
$161/Sq Ft
Est. Value
About This Home
This home is located at 620 Chaseridge Dr Unit III, McDonough, GA 30253 and is currently estimated at $338,905, approximately $161 per square foot. 620 Chaseridge Dr Unit III is a home located in Henry County with nearby schools including Flippen Elementary School, Eagle's Landing Middle School, and Eagle's Landing High School.
Ownership History
Date
Name
Owned For
Owner Type
Purchase Details
Closed on
May 9, 2017
Sold by
Evans Corey
Bought by
Evans Corey and Evans Tara Roshawda
Current Estimated Value
Home Financials for this Owner
Home Financials are based on the most recent Mortgage that was taken out on this home.
Original Mortgage
$174,677
Outstanding Balance
$146,107
Interest Rate
4.4%
Mortgage Type
FHA
Estimated Equity
$192,798
Purchase Details
Closed on
Jun 27, 2002
Sold by
Mackin Shaun J and Mackin Diana L
Bought by
Swalve Robert E and Swalve Ruth P
Purchase Details
Closed on
Oct 27, 2000
Sold by
Key Homes Inc
Bought by
Mackin Shaun J and Mackin Diana L
Home Financials for this Owner
Home Financials are based on the most recent Mortgage that was taken out on this home.
Original Mortgage
$136,586
Interest Rate
7.93%
Mortgage Type
VA
Create a Home Valuation Report for This Property
The Home Valuation Report is an in-depth analysis detailing your home's value as well as a comparison with similar homes in the area
Home Values in the Area
Average Home Value in this Area
Purchase History
| Date | Buyer | Sale Price | Title Company |
|---|---|---|---|
| Evans Corey | -- | -- | |
| Evans Corey | $177,900 | -- | |
| Swalve Robert E | $154,000 | -- | |
| Mackin Shaun J | $154,500 | -- |
Source: Public Records
Mortgage History
| Date | Status | Borrower | Loan Amount |
|---|---|---|---|
| Open | Evans Corey | $174,677 | |
| Closed | Evans Corey | $174,677 | |
| Previous Owner | Mackin Shaun J | $136,586 |
Source: Public Records
Tax History Compared to Growth
Tax History
| Year | Tax Paid | Tax Assessment Tax Assessment Total Assessment is a certain percentage of the fair market value that is determined by local assessors to be the total taxable value of land and additions on the property. | Land | Improvement |
|---|---|---|---|---|
| 2025 | $4,055 | $148,560 | $16,000 | $132,560 |
| 2024 | $4,055 | $143,200 | $16,000 | $127,200 |
| 2023 | $3,896 | $138,320 | $14,000 | $124,320 |
| 2022 | $3,638 | $110,320 | $14,000 | $96,320 |
| 2021 | $3,087 | $90,120 | $14,000 | $76,120 |
| 2020 | $2,821 | $80,080 | $12,000 | $68,080 |
| 2019 | $2,731 | $76,520 | $10,000 | $66,520 |
| 2018 | $2,533 | $71,160 | $9,820 | $61,340 |
| 2016 | $698 | $57,360 | $8,000 | $49,360 |
| 2015 | $675 | $52,840 | $8,000 | $44,840 |
| 2014 | $632 | $49,240 | $8,000 | $41,240 |
Source: Public Records
Map
Nearby Homes
- 682 Monticello Ln
- 340 Heavenly Hollow Place
- 332 Heavenly Hollow Place
- 337 Heavenly Hollow Place
- 349 Heavenly Hollow Place
- 660 Leafy Branch Way
- 648 Leafy Branch Way
- 604 Way
- 643 Leafy Branch Way
- 604 Leafy Branch Way
- 656 Leafy Branch Way
- 619 Leafy Branch Way
- 615 Leafy Branch Way
- Wynwood Plan at Bowers Farm - Single Family Homes
- Wagener Plan at Bowers Farm - Single Family Homes
- Pelham Plan at Bowers Farm - Single Family Homes
- Ridgewood Plan at Bowers Farm - Single Family Homes
- 220 Daileys Plantation Dr
- 250 Daileys Plantation Dr
- 0 Jonesboro Rd Unit 10537819
- 620 Chaseridge Dr
- 630 Chaseridge Dr
- 610 Chaseridge Dr
- 600 Chaseridge Dr
- 640 Chaseridge Dr Unit 3
- 615 Chaseridge Dr Unit III
- 635 Chaseridge Dr
- 605 Chaseridge Dr
- 590 Chaseridge Dr
- 648 Chaseridge Dr
- 645 Chaseridge Dr Unit III
- 595 Chaseridge Dr
- 580 Chaseridge Dr
- 655 Chaseridge Dr
- 880 Chaseridge Dr
- 652 Chaseridge Dr
- 665 Chaseridge Dr
- 585 Chaseridge Dr Unit III
- 550 Chaseridge Dr Unit 64
- 550 Chaseridge Dr