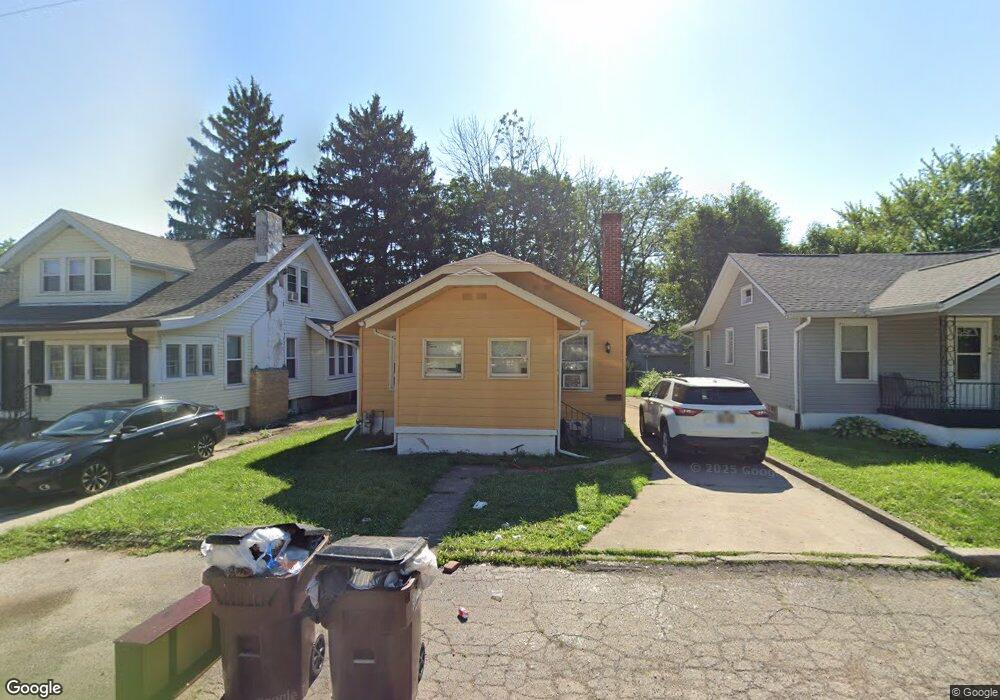
620 Daleview Ave Dayton, OH 45405
Fort McKinley NeighborhoodEstimated Value: $83,000 - $136,000
2
Beds
1
Bath
912
Sq Ft
$111/Sq Ft
Est. Value
About This Home
This home is located at 620 Daleview Ave, Dayton, OH 45405 and is currently estimated at $101,015, approximately $110 per square foot. 620 Daleview Ave is a home located in Montgomery County with nearby schools including Valerie Elementary School, Horizon Science Academy-Dayton Elementary School, and Horizon Science Academy Dayton High School.
Ownership History
Date
Name
Owned For
Owner Type
Purchase Details
Closed on
Apr 13, 2023
Sold by
Gordon Diversified Llc
Bought by
Gabbykris Property Llc
Current Estimated Value
Purchase Details
Closed on
Sep 6, 2019
Sold by
Gabbykris Property Llc
Bought by
Gordon Diversified Llc
Purchase Details
Closed on
Nov 24, 2009
Sold by
Federal Home Loan Mortgage Corporation
Bought by
Famal Gregory G
Purchase Details
Closed on
Sep 28, 2009
Sold by
Mitchell Cordell M
Bought by
Federal Home Loan Mortgage Corp
Purchase Details
Closed on
Oct 4, 2004
Sold by
Jacobs Irene
Bought by
Mitchell Cordell M
Home Financials for this Owner
Home Financials are based on the most recent Mortgage that was taken out on this home.
Original Mortgage
$33,660
Interest Rate
5.93%
Mortgage Type
Purchase Money Mortgage
Create a Home Valuation Report for This Property
The Home Valuation Report is an in-depth analysis detailing your home's value as well as a comparison with similar homes in the area
Home Values in the Area
Average Home Value in this Area
Purchase History
| Date | Buyer | Sale Price | Title Company |
|---|---|---|---|
| Gabbykris Property Llc | $50,000 | None Listed On Document | |
| Gordon Diversified Llc | $10,000 | None Available | |
| Famal Gregory G | $7,000 | Attorney | |
| Federal Home Loan Mortgage Corp | $26,000 | Attorney | |
| Mitchell Cordell M | $37,400 | None Available |
Source: Public Records
Mortgage History
| Date | Status | Borrower | Loan Amount |
|---|---|---|---|
| Previous Owner | Mitchell Cordell M | $33,660 |
Source: Public Records
Tax History Compared to Growth
Tax History
| Year | Tax Paid | Tax Assessment Tax Assessment Total Assessment is a certain percentage of the fair market value that is determined by local assessors to be the total taxable value of land and additions on the property. | Land | Improvement |
|---|---|---|---|---|
| 2024 | $1,567 | $18,230 | $3,190 | $15,040 |
| 2023 | $1,567 | $18,230 | $3,190 | $15,040 |
| 2022 | $1,577 | $13,410 | $2,350 | $11,060 |
| 2021 | $1,559 | $13,410 | $2,350 | $11,060 |
| 2020 | $1,498 | $13,410 | $2,350 | $11,060 |
| 2019 | $2,162 | $11,500 | $2,110 | $9,390 |
| 2018 | $1,510 | $11,500 | $2,110 | $9,390 |
| 2017 | $1,437 | $11,500 | $2,110 | $9,390 |
| 2016 | $1,777 | $12,580 | $2,350 | $10,230 |
| 2015 | $1,291 | $12,580 | $2,350 | $10,230 |
| 2014 | $1,291 | $12,580 | $2,350 | $10,230 |
| 2012 | -- | $14,970 | $5,010 | $9,960 |
Source: Public Records
Map
Nearby Homes
- 652 Syracuse Ave
- 4000 Merrimac Ave
- 55 E Siebenthaler Ave
- 200 E Siebenthaler Ave
- 44 Fer Don Rd
- 25 E Siebenthaler Ave
- 21 E Siebenthaler Ave
- 3851 Carroll Ave
- 15 Wampler Ave
- 144 Fer Don Rd
- 19 W Siebenthaler Ave
- 429 E Siebenthaler Ave
- 30 W Siebenthaler Ave
- 3815 Old Riverside Dr
- 210 Castlewood Ave
- 32 Stafford Ave
- 333 E Nottingham Rd
- 3303 N Main St
- 138 Northwood Ave
- 4060 Halworth Rd
- 624 Daleview Ave
- 616 Daleview Ave
- 628 Daleview Ave
- 632 Daleview Ave
- 205 Redwood Ave
- 211 Redwood Ave
- 3819 Addison Ave
- 201 Redwood Ave
- 3823 Addison Ave
- 3815 Addison Ave
- 636 Daleview Ave
- 215 Redwood Ave
- 3827 Addison Ave
- 219 Redwood Ave
- 615 Daleview Ave
- 625 Daleview Ave
- 3831 Addison Ave
- 125 Redwood Ave
- 640 Daleview Ave
- 629 Daleview Ave