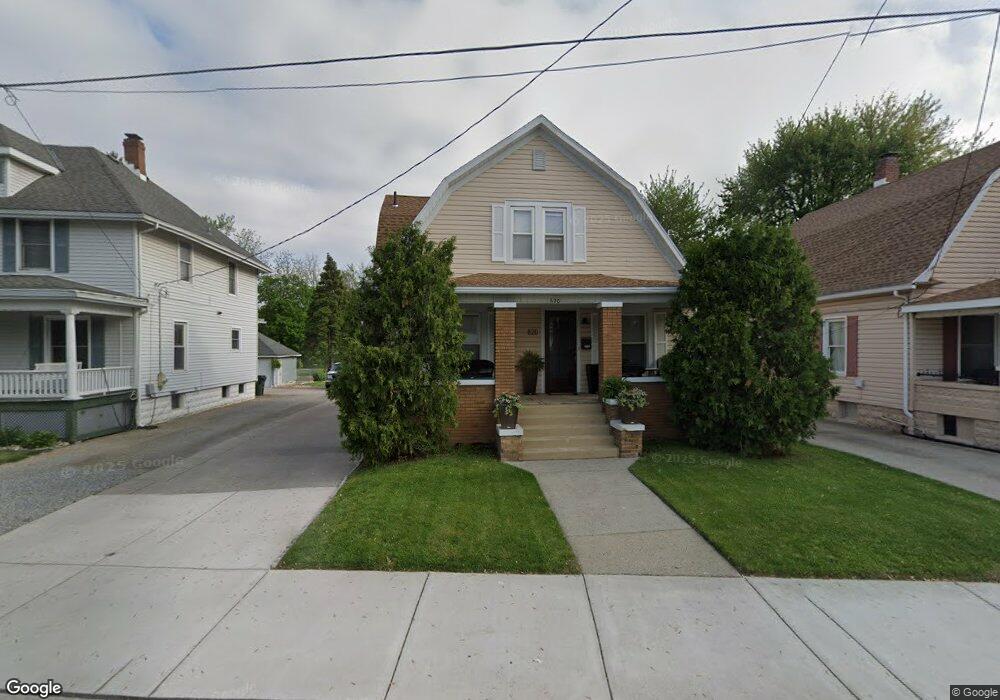
620 E 5th St Delphos, OH 45833
Estimated Value: $157,000 - $175,000
2
Beds
1
Bath
1,620
Sq Ft
$102/Sq Ft
Est. Value
About This Home
This home is located at 620 E 5th St, Delphos, OH 45833 and is currently estimated at $165,833, approximately $102 per square foot. 620 E 5th St is a home located in Allen County with nearby schools including Delphos St. John's High School and Delphos St. John's Elementary School.
Ownership History
Date
Name
Owned For
Owner Type
Purchase Details
Closed on
Aug 16, 1996
Sold by
Wehner Terry
Bought by
Wisher Frank and Wisher Terrie
Current Estimated Value
Home Financials for this Owner
Home Financials are based on the most recent Mortgage that was taken out on this home.
Original Mortgage
$31,000
Interest Rate
8.18%
Mortgage Type
New Conventional
Purchase Details
Closed on
Jun 11, 1993
Sold by
Horn William A
Bought by
Wehner Terry G
Purchase Details
Closed on
Apr 9, 1986
Bought by
Horn William A
Create a Home Valuation Report for This Property
The Home Valuation Report is an in-depth analysis detailing your home's value as well as a comparison with similar homes in the area
Home Values in the Area
Average Home Value in this Area
Purchase History
| Date | Buyer | Sale Price | Title Company |
|---|---|---|---|
| Wisher Frank | $69,000 | -- | |
| Wehner Terry G | $45,000 | -- | |
| Horn William A | $41,600 | -- |
Source: Public Records
Mortgage History
| Date | Status | Borrower | Loan Amount |
|---|---|---|---|
| Closed | Wisher Frank | $31,000 |
Source: Public Records
Tax History
| Year | Tax Paid | Tax Assessment Tax Assessment Total Assessment is a certain percentage of the fair market value that is determined by local assessors to be the total taxable value of land and additions on the property. | Land | Improvement |
|---|---|---|---|---|
| 2024 | $1,389 | $44,910 | $5,430 | $39,480 |
| 2023 | $1,096 | $33,530 | $4,060 | $29,470 |
| 2022 | $1,122 | $33,530 | $4,060 | $29,470 |
| 2021 | $1,130 | $33,530 | $4,060 | $29,470 |
| 2020 | $973 | $30,350 | $3,890 | $26,460 |
| 2019 | $973 | $30,350 | $3,890 | $26,460 |
| 2018 | $1,012 | $30,350 | $3,890 | $26,460 |
| 2017 | $911 | $27,940 | $3,890 | $24,050 |
| 2016 | $925 | $27,940 | $3,890 | $24,050 |
| 2015 | $823 | $27,940 | $3,890 | $24,050 |
| 2014 | $823 | $24,890 | $3,750 | $21,140 |
| 2013 | $828 | $24,890 | $3,750 | $21,140 |
Source: Public Records
Map
Nearby Homes
- 821 E 3rd St
- 704 N Franklin St
- 405 N Franklin St
- 201 E 5th St
- 610 N Washington St
- 702 N Main St
- 629 N Main St
- 221 S Main St
- 483 S Franklin St
- 424 S Canal St
- 409 N Bredeick St
- 310 E Suthoff St
- 709 W 4th St
- 537 / 539 Toomey
- 1000 Colettas Way
- 420 S Cass St
- 708 W 1st St
- 827 S Washington St
- 10429 Ohio 66
- 7110 Elida Rd
Your Personal Tour Guide
Ask me questions while you tour the home.