Estimated Value: $460,000 - $527,000
3
Beds
1
Bath
1,294
Sq Ft
$382/Sq Ft
Est. Value
About This Home
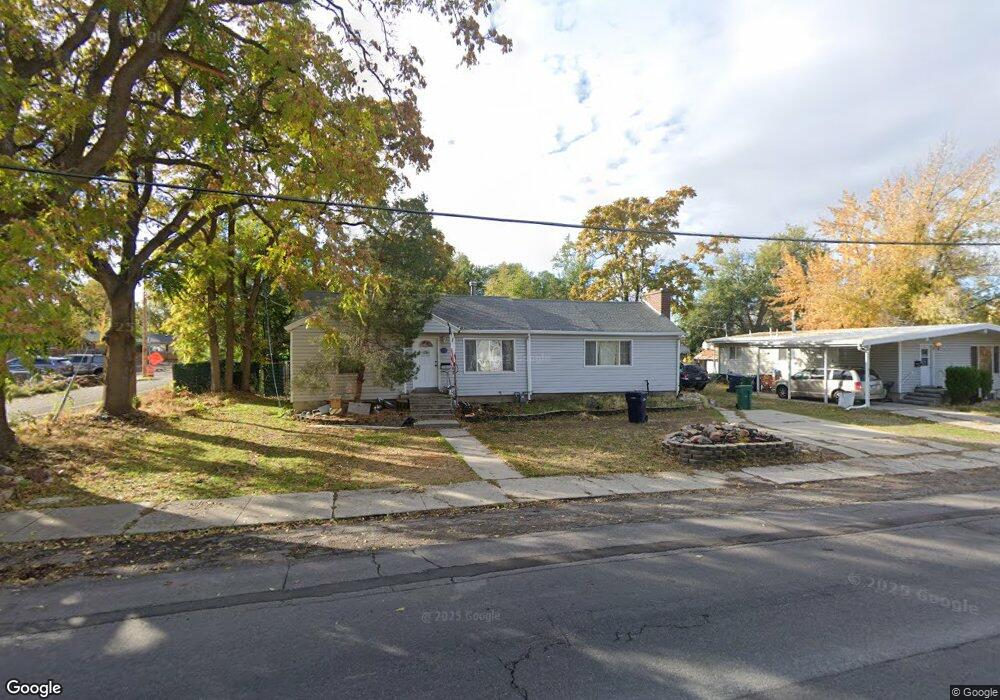
This home is located at 620 E 8800 S, Sandy, UT 84070 and is currently estimated at $493,861, approximately $381 per square foot. 620 E 8800 S is a home located in Salt Lake County with nearby schools including Sandy Elementary School, Mount Jordan Middle School, and Jordan High.
Ownership History
Date
Name
Owned For
Owner Type
Purchase Details
Closed on
Dec 27, 2021
Sold by
Ryan Pollitz
Bought by
Harmsen Joseph R
Current Estimated Value
Home Financials for this Owner
Home Financials are based on the most recent Mortgage that was taken out on this home.
Original Mortgage
$342,975
Outstanding Balance
$315,553
Interest Rate
2.98%
Mortgage Type
New Conventional
Estimated Equity
$178,308
Purchase Details
Closed on
Sep 29, 2017
Sold by
Pollitz Jessica
Bought by
Pollitz Ryan
Purchase Details
Closed on
Apr 19, 2007
Sold by
Mcnees Jeffrey Lynn and Mcnees Syndi L
Bought by
Pollitz Ryan and Pollitz Jessica
Home Financials for this Owner
Home Financials are based on the most recent Mortgage that was taken out on this home.
Original Mortgage
$197,500
Interest Rate
6.1%
Mortgage Type
Purchase Money Mortgage
Purchase Details
Closed on
Nov 5, 1998
Sold by
Brooksby Carolyn Russell and Livingston Frances Russell
Bought by
Mcnees Jeffrey Lynn and Mcnees Syndi L
Create a Home Valuation Report for This Property
The Home Valuation Report is an in-depth analysis detailing your home's value as well as a comparison with similar homes in the area
Home Values in the Area
Average Home Value in this Area
Purchase History
| Date | Buyer | Sale Price | Title Company |
|---|---|---|---|
| Harmsen Joseph R | -- | Capstone Title & Escrow | |
| Harmsen Joseph R | -- | Capstone Title & Escrow | |
| Pollitz Ryan | -- | None Available | |
| Pollitz Ryan | -- | Us Title Of Utah | |
| Mcnees Jeffrey Lynn | -- | -- |
Source: Public Records
Mortgage History
| Date | Status | Borrower | Loan Amount |
|---|---|---|---|
| Open | Harmsen Joseph R | $342,975 | |
| Previous Owner | Pollitz Ryan | $197,500 |
Source: Public Records
Tax History Compared to Growth
Tax History
| Year | Tax Paid | Tax Assessment Tax Assessment Total Assessment is a certain percentage of the fair market value that is determined by local assessors to be the total taxable value of land and additions on the property. | Land | Improvement |
|---|---|---|---|---|
| 2025 | $2,289 | $485,900 | $132,500 | $353,400 |
| 2024 | $2,289 | $423,300 | $121,500 | $301,800 |
| 2023 | $2,061 | $380,100 | $115,500 | $264,600 |
| 2022 | $2,197 | $395,700 | $113,300 | $282,400 |
| 2021 | $2,111 | $323,700 | $88,700 | $235,000 |
| 2020 | $1,983 | $286,800 | $88,700 | $198,100 |
| 2019 | $2,484 | $265,400 | $84,200 | $181,200 |
| 2016 | $1,475 | $199,800 | $60,600 | $139,200 |
Source: Public Records
Map
Nearby Homes
- 608 E 8800 S
- 8732 S 620 E
- 8915 S 660 E Unit 103
- 627 E 8680 S
- 8797 Green Way Unit 3
- 8729 S Leafwood Ln
- 8722 S Oakwood Park Cir Unit 8722
- 547 E Pioneer Ave
- 8823 S 300 E
- 354 E 8620 S
- 386 Pioneer Ave
- 807 E Whisper Cove Rd
- 431 E 9150 S
- 744 E 8425 S
- 9083 Enchanted Oak Ln
- 8459 S 300 E
- 9144 S Peach Blossom Dr
- 8322 S Levine Ln Unit 111
- 783 E Newfield Dr Unit 146
- 8643 Vaquero Dr