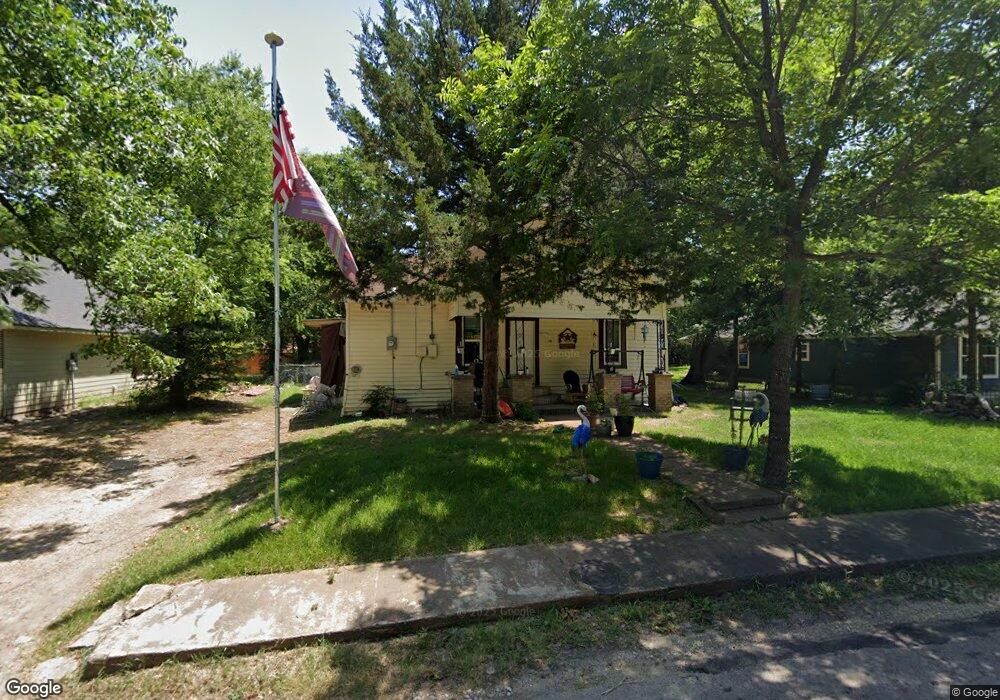
620 E 8th St Bonham, TX 75418
Estimated Value: $150,977 - $197,000
3
Beds
1
Bath
1,316
Sq Ft
$134/Sq Ft
Est. Value
About This Home
This home is located at 620 E 8th St, Bonham, TX 75418 and is currently estimated at $176,244, approximately $133 per square foot. 620 E 8th St is a home located in Fannin County with nearby schools including Evans Elementary School, Finley-Oates Elementary School, and LH Rather Jr High School.
Ownership History
Date
Name
Owned For
Owner Type
Purchase Details
Closed on
Oct 29, 2018
Sold by
Santos Holly Denice
Bought by
Sideline Rental Properties Llc
Current Estimated Value
Purchase Details
Closed on
Feb 28, 2018
Sold by
Sideline Rental Properties Llc
Bought by
Santos Holly Denice
Home Financials for this Owner
Home Financials are based on the most recent Mortgage that was taken out on this home.
Original Mortgage
$54,000
Interest Rate
4.04%
Mortgage Type
Purchase Money Mortgage
Purchase Details
Closed on
Mar 12, 2012
Sold by
Mattox Judy and Washington Raymond
Bought by
Fraser Roebrt and Fraser Ashlea
Home Financials for this Owner
Home Financials are based on the most recent Mortgage that was taken out on this home.
Original Mortgage
$11,050
Interest Rate
4.05%
Mortgage Type
Purchase Money Mortgage
Create a Home Valuation Report for This Property
The Home Valuation Report is an in-depth analysis detailing your home's value as well as a comparison with similar homes in the area
Purchase History
| Date | Buyer | Sale Price | Title Company |
|---|---|---|---|
| Sideline Rental Properties Llc | -- | None Available | |
| Santos Holly Denice | -- | Cole Title Co | |
| Fraser Roebrt | -- | None Available |
Source: Public Records
Mortgage History
| Date | Status | Borrower | Loan Amount |
|---|---|---|---|
| Previous Owner | Santos Holly Denice | $54,000 | |
| Previous Owner | Fraser Roebrt | $11,050 |
Source: Public Records
Tax History
| Year | Tax Paid | Tax Assessment Tax Assessment Total Assessment is a certain percentage of the fair market value that is determined by local assessors to be the total taxable value of land and additions on the property. | Land | Improvement |
|---|---|---|---|---|
| 2025 | $2,672 | $137,760 | $50,740 | $87,020 |
| 2024 | $2,729 | $140,720 | $48,790 | $91,930 |
| 2023 | $2,603 | $132,000 | $43,140 | $88,860 |
| 2022 | $2,642 | $120,140 | $31,000 | $89,140 |
| 2021 | $2,250 | $89,030 | $14,730 | $74,300 |
| 2020 | $995 | $38,930 | $11,880 | $27,050 |
| 2019 | $1,015 | $38,180 | $9,620 | $28,560 |
| 2018 | $900 | $33,900 | $9,150 | $24,750 |
| 2017 | $698 | $27,310 | $5,230 | $22,080 |
| 2016 | $624 | $24,410 | $5,230 | $19,180 |
| 2015 | -- | $24,950 | $4,990 | $19,960 |
| 2014 | -- | $23,940 | $4,040 | $19,900 |
Source: Public Records
Map
Nearby Homes
Your Personal Tour Guide
Ask me questions while you tour the home.