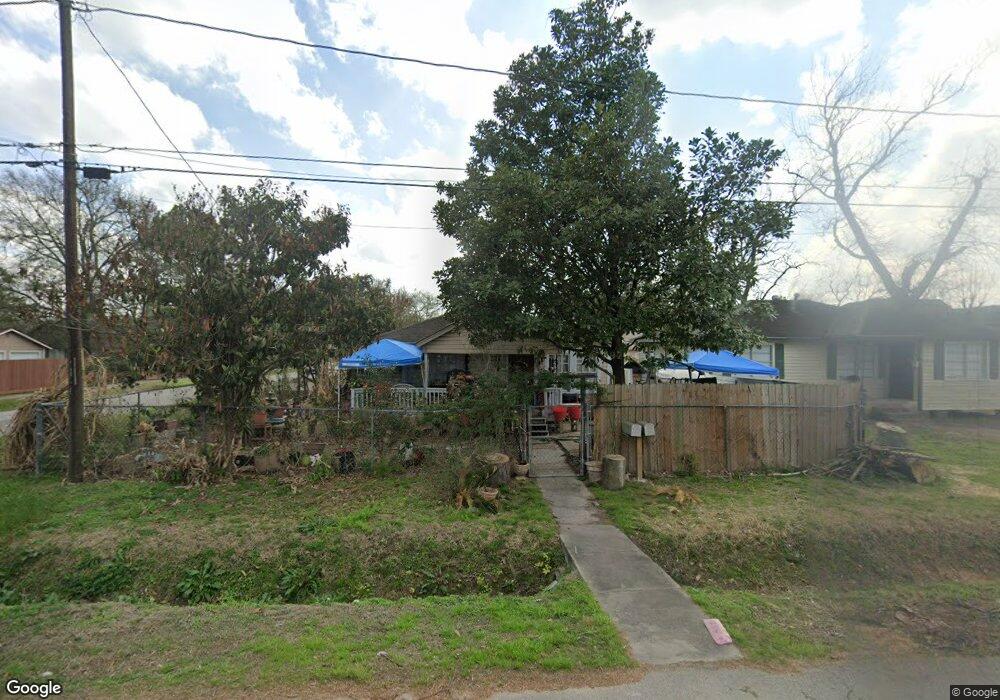
620 Firnat St Houston, TX 77022
Northside-Northline NeighborhoodEstimated Value: $186,472 - $302,000
4
Beds
3
Baths
2,178
Sq Ft
$109/Sq Ft
Est. Value
About This Home
This home is located at 620 Firnat St, Houston, TX 77022 and is currently estimated at $237,118, approximately $108 per square foot. 620 Firnat St is a home located in Harris County with nearby schools including Burbank Elementary School, Burbank Middle School, and Sam Houston Math, Science & Technology Center.
Ownership History
Date
Name
Owned For
Owner Type
Purchase Details
Closed on
Nov 10, 1997
Sold by
Flores Rosa M
Bought by
Sanchez Noe Vilanova
Current Estimated Value
Purchase Details
Closed on
Oct 12, 1995
Sold by
Jones Caroline and Jones Larry
Bought by
Flores Rosa M
Home Financials for this Owner
Home Financials are based on the most recent Mortgage that was taken out on this home.
Original Mortgage
$34,000
Interest Rate
7.6%
Mortgage Type
Seller Take Back
Create a Home Valuation Report for This Property
The Home Valuation Report is an in-depth analysis detailing your home's value as well as a comparison with similar homes in the area
Home Values in the Area
Average Home Value in this Area
Purchase History
| Date | Buyer | Sale Price | Title Company |
|---|---|---|---|
| Sanchez Noe Vilanova | -- | Texas American Title Company | |
| Flores Rosa M | -- | Texas American Title Company |
Source: Public Records
Mortgage History
| Date | Status | Borrower | Loan Amount |
|---|---|---|---|
| Previous Owner | Flores Rosa M | $34,000 |
Source: Public Records
Tax History Compared to Growth
Tax History
| Year | Tax Paid | Tax Assessment Tax Assessment Total Assessment is a certain percentage of the fair market value that is determined by local assessors to be the total taxable value of land and additions on the property. | Land | Improvement |
|---|---|---|---|---|
| 2025 | $853 | $181,413 | $81,130 | $100,283 |
| 2024 | $853 | $173,675 | $74,458 | $99,217 |
| 2023 | $853 | $186,926 | $45,369 | $141,557 |
| 2022 | $2,872 | $155,500 | $45,369 | $110,131 |
| 2021 | $2,764 | $125,282 | $45,369 | $79,913 |
| 2020 | $2,611 | $114,729 | $45,369 | $69,360 |
| 2019 | $2,480 | $110,930 | $37,363 | $73,567 |
| 2018 | $1,511 | $89,094 | $31,224 | $57,870 |
| 2017 | $2,051 | $89,094 | $31,224 | $57,870 |
| 2016 | $1,698 | $68,810 | $29,356 | $39,454 |
| 2015 | $1,082 | $61,046 | $21,350 | $39,696 |
| 2014 | $1,082 | $61,046 | $21,350 | $39,696 |
Source: Public Records
Map
Nearby Homes
- 807 Firnat St
- 723 Doverside St
- 9026 Mcgallion Rd
- 702 Pennington St
- 88 Berry Rd
- 411 Berry Rd
- 1207 Firnat St
- 8411 Berry Brush Ln
- 318 Charlock St
- 8402 Berry Green Ln
- 802 Berry Sage Ln
- 8205 Appleton St
- 253 De Boll St
- 249 De Boll St
- 216 Burress St
- 1104 Charnwood St
- 132 Grothe Ln
- 631 Apache St
- 108 Fichter St
- 0 Appleton St